


Data Insights: Black Friday 2020
This report shares insights into shopper behavior on Black Friday 2020, the first ever digitally dominant holiday following the onset of the pandemic. It further reveals how these behaviors compare to Black Friday 2019 and in one instance how these behaviors compare to October 2020 (the unofficial start of the 2020 holiday season, kicking off with Amazon’s Prime Day), May 2020 (the unofficial indicator of the acceleration to ecommerce, which saw Black Friday-like sales).
Bluecore derived this data from 1.5 billion first-party cookies, 1 billion cart events, 4.4 million unique products, 58.8 million orders and $7.1 billion in total sales across 159 retail brands (52 Apparel, 11 Beauty, 20 Footwear, 15 Home, 10 Jewelry, 10 Technology, 41 Other).
The resulting insights are based on analysis of a total of 9.7 billion shopper events on these brands’ ecommerce sites, including shoppers adding product(s) to cart, conducting keyword searches, viewing products and completing sales transactions.
Bluecore gathered and analyzed this data on Black Friday 2020. The complete methodology can be found in the Appendix of this report.
These insights offer retailers visibility into the trends that will not only impact sales for the remainder of the year, but also demonstrate fundamental changes for consumers as they fully settle into this digital-first world.

QUESTION #1: DID RETAIL BRANDS SEE REPEAT PURCHASES ON BLACK FRIDAY 2020? OR WERE MOST CUSTOMERS FIRST-TIME BUYERS?
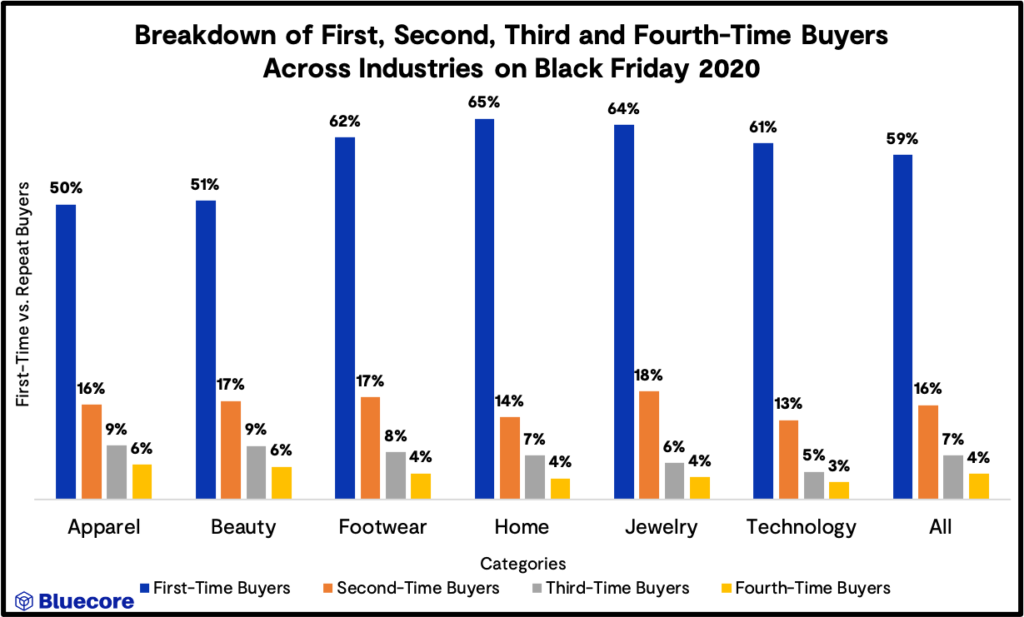
- Across all sub-verticals, most buyers were first-time buyers — a typical trend for this shopping holiday as brands draw new shoppers in with heavy promotions.
- The large number of first-time buyers represents a major retention opportunity for brands to drive repeat purchases and gain significant potential revenue for a retailer: Getting 2,200 buyers (22% of 10,000 first time buyers) who purchased for the first time on Black Friday to purchase again throughout the year represents a $187K revenue opportunity for retailers that have an AOV of $50 and $374K for retailers that have an AOV of $100. This calculation is: Number of first time buyers * re-purchase rate * average number of orders placed after Black Friday * AOV. In this case: 22% repurchase rate * 10,000 first time buyers * 1.7 orders after Black Friday * $50 AOV (or $100).
Why is this important? Sixty percent of second purchases occur within 100 days after the first purchase. Following that first 100 days, the chances of a second purchase remain stagnant temporarily before ultimately dipping below 10%. With every purchase customers make, the likelihood that they will return increases. Retailers see the biggest jump in likelihood to purchase again between one-time buyers and two-time buyers, as the chances nearly double.
QUESTION 2: DID BRANDS SEE MORE FIRST AND SECOND-TIME BUYERS ON BLACK FRIDAY 2020 COMPARED TO BLACK FRIDAY 2019?
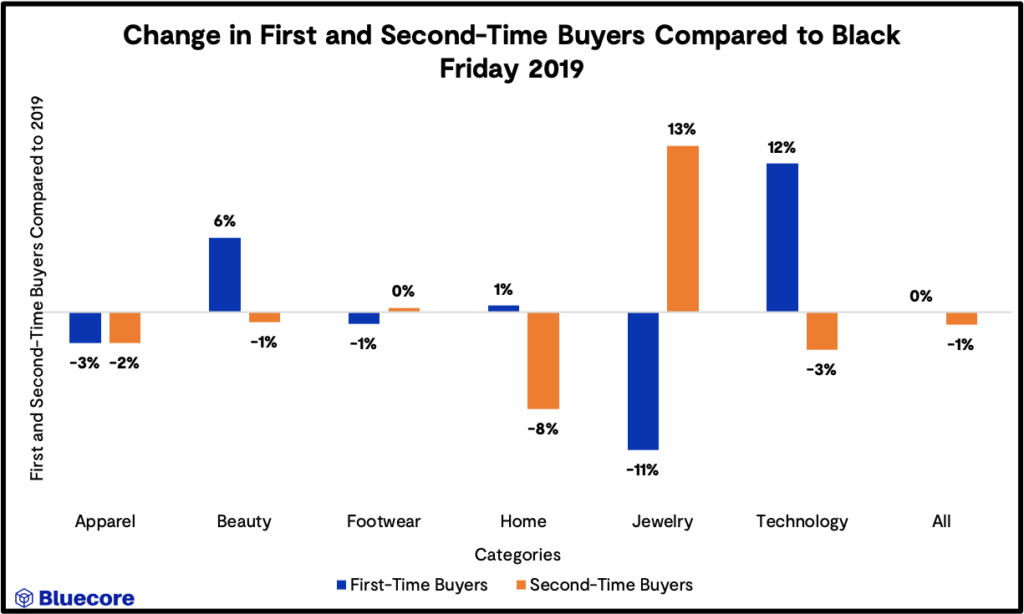
- The proportion of the percentage decrease in first-time buyers for Jewelry could be indicative of a prolonged holiday season, with less emphasis on Black Friday and more general focus on the holidays as a whole, since this is a common gift category.
- Jewelry’s increase in second time buyers could be an indication of “revenge spending” where shoppers with disposable income are shifting spending from travel to things such as luxury goods, and shoppers sticking to brands they know since they can’t try on pieces in-store.
- Apparel saw the biggest percentage decrease in first and second time buyers, which could indicate that these buyers purchased ahead of Black Friday, in line with many apparel brands starting promotions earlier compared to last year.
- Home’s decrease in second time buyers potentially points to two key changes in consumer behavior in 2020:
- With lock-downs in effect months prior to Black Friday, shoppers had already invested in WFH goods and other houseware items earlier in the year
- With the uncertainty of the current environment, some individuals’ home locations are in flux, and as such, some are not investing in home goods at this time
QUESTION #3: HOW MANY SHOPPERS BECAME REPEAT BUYERS OF BRANDS THEY FIRST DISCOVERED DURING THE PANDEMIC?
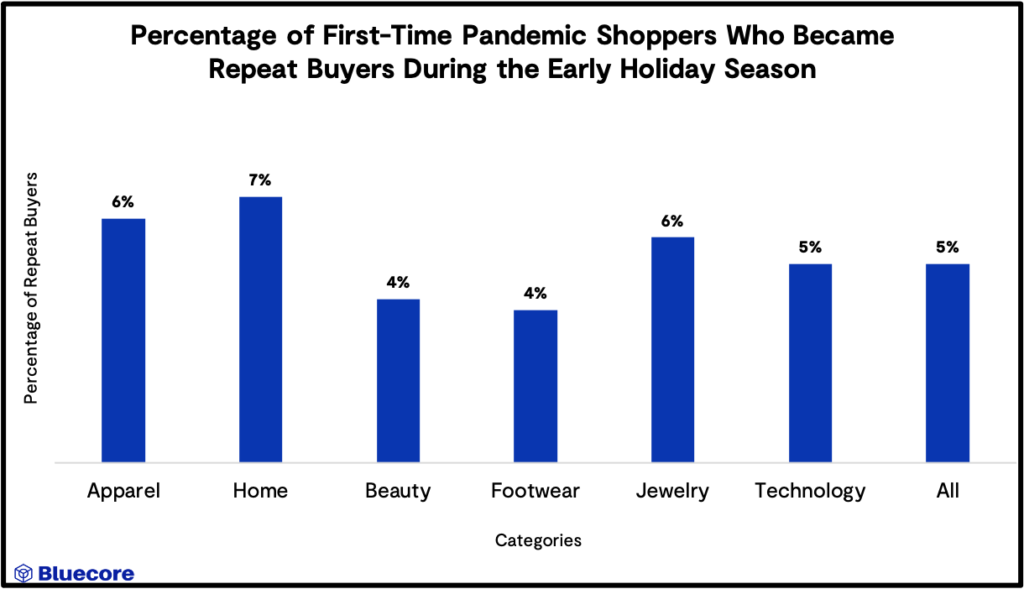
- On average, 5% of shoppers who first bought from a brand during the pandemic (between March 1 – September 30) made repeat purchases during the early holiday season (Oct 1 – November 27, Black Friday).
- Overall, brands across all industries were able to bring back a small proportion of first-time buyers during the holiday season. These shoppers are 130% more valuable than they were when they made their first-purchase.
QUESTION #4: HOW DOES SITE TRAFFIC ON BLACK FRIDAY 2020 COMPARE TO BLACK FRIDAY 2019?
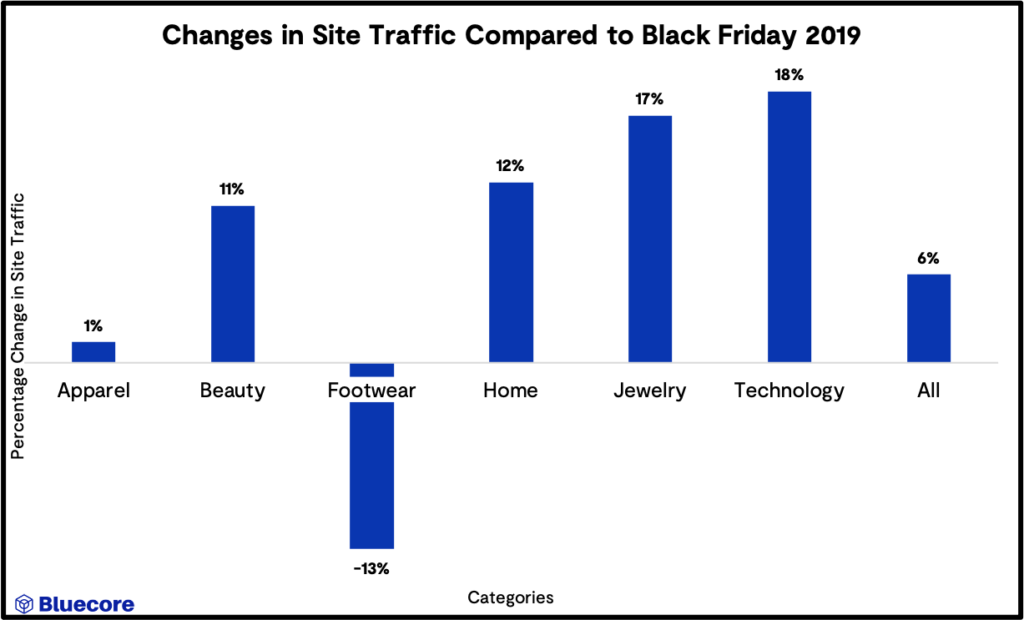
- With the exception of Footwear, site traffic increased across all industries.
- The decrease in Footwear is likely indicative of the fact that many people are now working from home and have less need for new shoes.
QUESTION #5: ARE BLACK FRIDAY PURCHASES MORE LIKELY TO BE PLANNED OR IMPULSE BUYS?
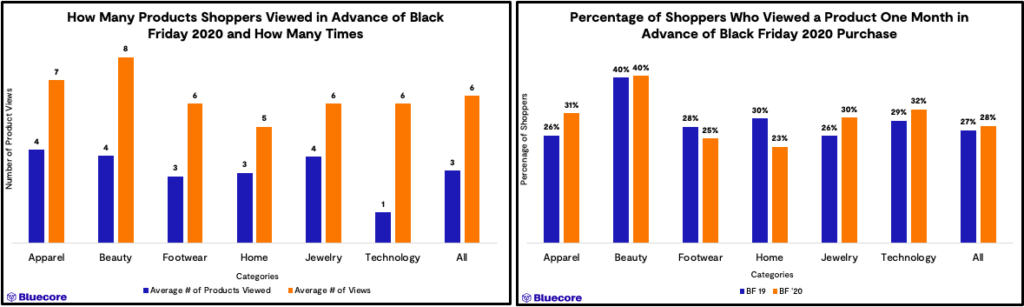
- The majority of Black Friday purchases (72%) are impulse purchases across all industries. This represents a huge opportunity for retailers, who, with relevant communications, can convert first-time buyers into repeat customers.
- 28% of purchases are considered or researched purchases (as indicated by shoppers viewing products, often more than once in the month leading up to Black Friday).
QUESTION #6: DID SHOPPERS PLACE MORE ORDERS ON BLACK FRIDAY 2020 COMPARED TO BLACK FRIDAY 2019?
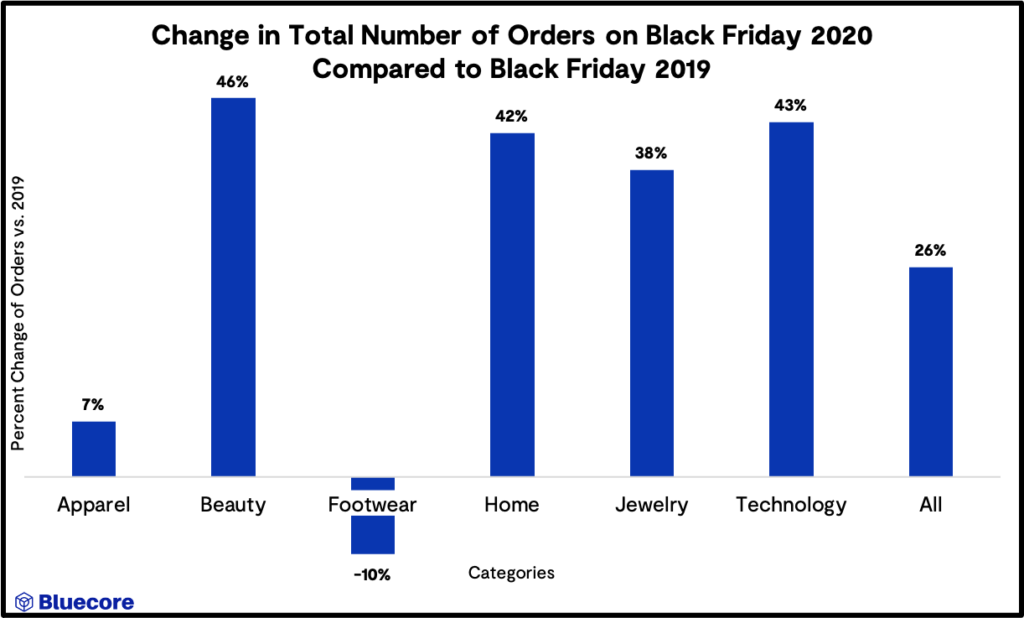
- With the exception of Footwear, all industries saw an increase in the total number of orders.
- The significant increases in Beauty, Home, Jewelry, and Technology are indicative of the massive shift to online shopping amidst store closures and in-person regulations.
- The decrease in total number of orders for Footwear is consistent with the decrease in site traffic – both indicative of the fact that many people are now working from home and have less need for new shoes.
APPENDIX
DETAILED METHODOLOGY
These insights are derived from Black Friday UTC (7PM EST Thursday 11/26 – 7PM EST Friday 11/27).
Q1: Did retail brands see more repeat purchases on Black Friday 2020? Or are most customers first-time buyers?
For 159 retailers (52 Apparel, 11 Beauty, 20 Footwear, 15 Home, 10 Jewelry, 10 Technology, 41 Other), we calculated the percentage of first-time, second-time, third-time, and fourth-time buyers on Black Friday 2020.
Q2: Did brands see more first and second-time buyers on Black Friday 2020 compared to Black Friday 2019?
For 159 retailers (52 Apparel, 11 Beauty, 20 Footwear, 15 Home, 10 Jewelry, 10 Technology, 41 Other), we calculated the percentage of first-time and second-time buyers on Black Friday 2020 and compared that to the percentage of first and second-time buyers in 2019.
Q3: How many shoppers became repeat buyers of brands they first discovered during the pandemic?
For 159 retailers (52 Apparel, 11 Beauty, 20 Footwear, 15 Home, 10 Jewelry, 10 Technology, 41 Other), we calculated purchased during the pandemic, the proportion of buyers who made their first purchase from 3/1 – 9/30 and purchased again in the early holiday season, defined as 10/1 – Black Friday (11/27)
Q4: How does site traffic on Black Friday 2020 compare to Black Friday 2019?
For 159 retailers (52 Apparel, 11 Beauty, 20 Footwear, 15 Home, 10 Jewelry, 10 Technology, 41 Other) in 2020:
- 52 retailers have < 20,000 cookies onsite on a typical day (‘smaller’), 69 retailers have between 20K-100K cookies onsite on a typical day and 37 retailers have > 100K people on-site on a typical day in 2019.
- A customer is considered on-site if one of the following retail-specific actions is taken: add to cart, viewed cart, viewed product, search, browse category, or purchase. As such, homepage visits are not included.
- For each retailer, site traffic on Black Friday is compared to that of a typical day, the average of May 2020, and the average of October 2020, and the factor is calculated as: number of cookies on-site on Black Friday/number of cookies on-site on a typical day, May 2020 and October 2020.
For each industry, the median factor is calculated and can be interpreted as described.
Q5. Are Black Friday purchases more likely to be planned or impulse buys?
For 159 retailers (52 Apparel, 11 Beauty, 20 Footwear, 15 Home, 10 Jewelry, 10 Technology, 41 Other) in 2020 we calculated proportion of Black Friday shoppers viewed a product within the entire month prior to the day. For each retailer calculate the following and take the median values for each industry:
- Average number of products viewed: average number of distinct products (as calculated using the product id field) viewed in the month prior to Black Friday.
- Average number of views: average number of distinct views in the month prior to Black Friday (a single product can be viewed multiple times).
- Proportion of Black Friday shoppers that viewed: the proportion of all the customers who made a purchase online on Black Friday that viewed at least once in the month prior.
Q6: Did shoppers place more orders on Black Friday 2020 compared to Black Friday 2019?
For 159 retailers (52 Apparel, 11 Beauty, 20 Footwear, 15 Home, 10 Jewelry, 10 Technology, 41 Other) in 2020 we calculated proportion of Black Friday shoppers who placed an order on Black Friday 2020 and compared it to the proportion of shoppers who placed an order on Black Friday 2019, operating off of UTC time zone.