Executive Summary
Black Friday looked a little different this year.
One thing that remained the same: Bluecore gathered Black Friday data to track movement in the retail industry and get insights into how shoppers are interacting with both brands and products, and how consumer behaviors have changed year-over-year.
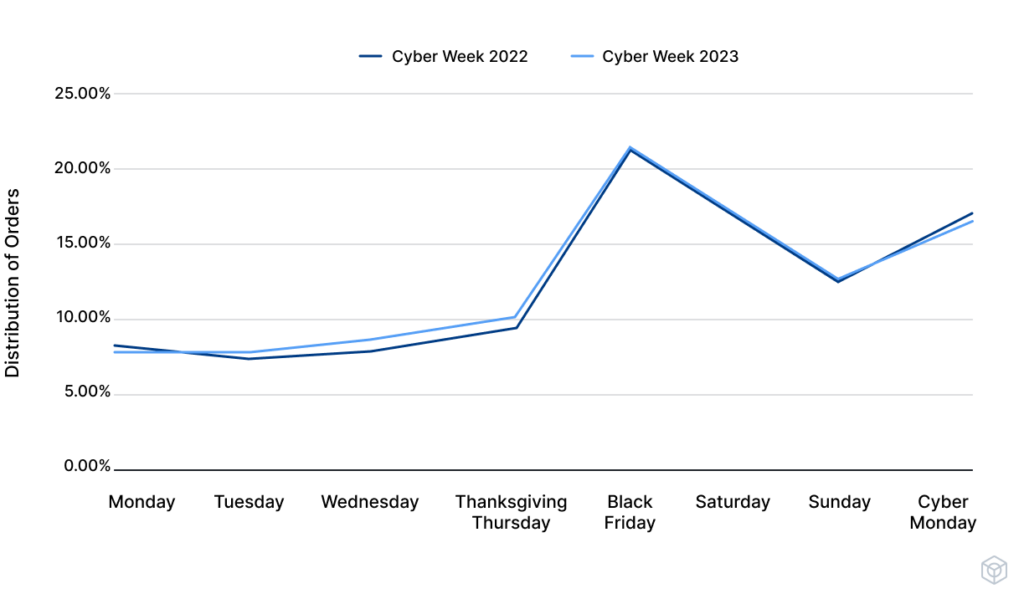
We focused our analysis on Black Friday because like last year, that was the busiest shopping day for our platform. Looking at eight days of orders — from Monday, November 20, through (Cyber) Monday, November 27 — we found that more than 20% were placed on Black Friday.
The Distribution of Orders Throughout Cyber Week
Our in-house team of retail strategists analyzed proprietary data across 68,646,309 first-party cookies, 6,997,566 unique products, 10,014,908 orders, $1,264,344,495 in total sales, and 911,239,468 shopper events for a segment of retail’s top enterprise and DTC brands across apparel, consumer electronics, footwear, health and beauty, home goods, luxury and jewelry, sporting goods and outdoors, and toys and gifts.
Why should you read (and share) this data?
These Black Friday trends point to the metrics that matter, informing retailers’ strategies in pursuit of their ultimate goal: driving profitable growth.
Our Black Friday data goes beyond site traffic and conversion results – we’re looking at deeper trends around identification rates, how well retailers moved their shoppers to first-time buyers and previous customers to multi-time buyers, retention-specific metrics around repeat shopping, and the performance of various site and email campaigns.
The main takeaway is that large enterprise retailers outperformed their mid-market counterparts with their use of data.
To replicate their approach, retailers must prioritize:
- Increasing identification: This is the foundation of all personalized marketing. Simply put, retailers can’t effectively communicate with shoppers without first knowing who they are. While large enterprise retailers increased identification rate year-over-year, the majority of shoppers are still unidentified across categories, representing a major opportunity.
- Capitalizing on moments of intent: Shoppers are doing a lot of research, viewing multiple products, multiple times at various points during the holiday season, showing much more consideration for their purchases. Retailers and brands must recognize when shoppers are showing intent to buy and understand individual affinities for product categories, styles, discounts, and more to effectively nurture abandoned sessions, searches, and carts into purchases.
- Creating a Customer Movement strategy: Retailers know they must focus on retention. That requires a holistic view of buyer types and segment performance in order to move first-time buyers into repeat buyers and continue that cycle. At the same time, retailers should also focus on driving loyalty with their existing customers — a cohort that’s much more significant with large enterprise retailers.
Black Friday Website Traffic and Shopper Identification
Key Insight: Large enterprise retailers increase their identification rates, leaving mid-market retailers with major opportunities for better reach.
How Black Friday Site Traffic Changed Year-Over-Year
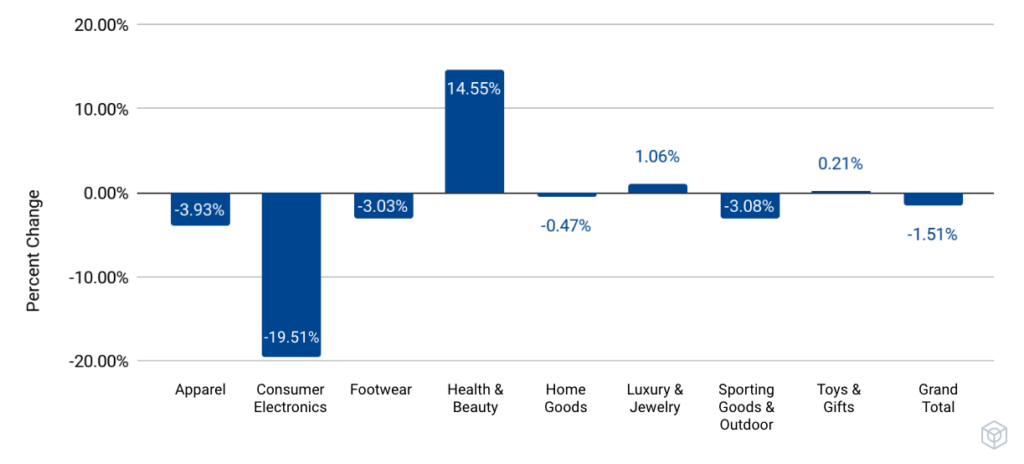
Overall, website traffic decreased year-over-year by 1.5%. While a dip in Black Friday site traffic initially sounds surprising, it makes sense. Retailers began their holiday campaigns in August while McKinsey’s ConsumerWise Consumer Community Survey found that 50% of shoppers started before Halloween.
“The holidays” begin earlier and earlier, allowing consumers to be more considerate in spending and spread out their budgets. This is particularly relevant for the consumer electronics category, once synonymous with Black Friday sales.
Only health and beauty experienced a large increase in traffic. However, this spike was very concentrated among the largest brands with the strongest loyalty, an ongoing theme in our Black Friday data.
Percentage of Unidentified, Newly Identified, and Previously Identified Black Friday Site Visitors
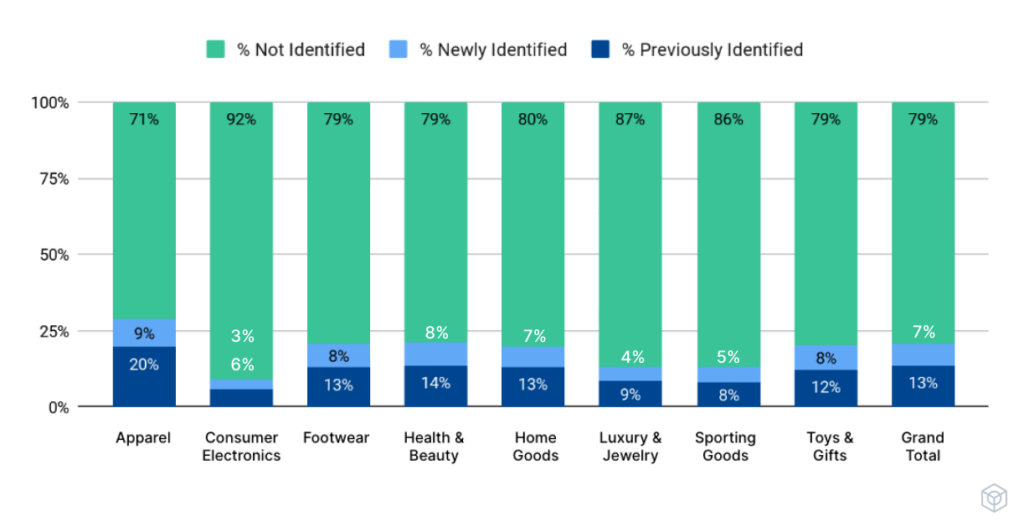
To capitalize on the holiday spikes in site traffic, brands must first be able to identify their visitors. Defined as the percentage of website visitors who can be identified by an attribute, such as an email or phone number tied back to a unified profile, customer identification remains a struggle for retailers.
The vast majority (79%) of Black Friday shoppers remain unidentified, with brands able to identify just 7% of their total new shoppers. Retailers have much stronger identity recognition on desktop, identifying 29.69% of shoppers on that channel vs. 22.34% on mobile.
While overall identification rate remained relatively flat year-over-year, a closer look showed us one of the most staggering Black Friday trends. Large enterprise retailers, defined as those who saw at least 250,000 unique customers on Black Friday, increased identification rate by 12% year-over-year. Meanwhile, mid-market brands’ rate decreased by 4%.
Identification is ultimately the foundation of all retention marketing. When retailers know who customers are, they’re in a much better position to “move” them through the purchase funnel in the short-term and continue to build a relationship for the long-term.
Larger retailers understand this well and this sets them up for success as we’ll see throughout the report. They had the data to identify a greater share of their shoppers, which is especially critical when there are so many of them. Black Friday trends showed that traffic was down relative to last year, though it still exceeded that of a typical day.
Consumer Purchase and Spending Trends
Key Insight: Consumers show high consideration for purchases while average order values decrease across categories.
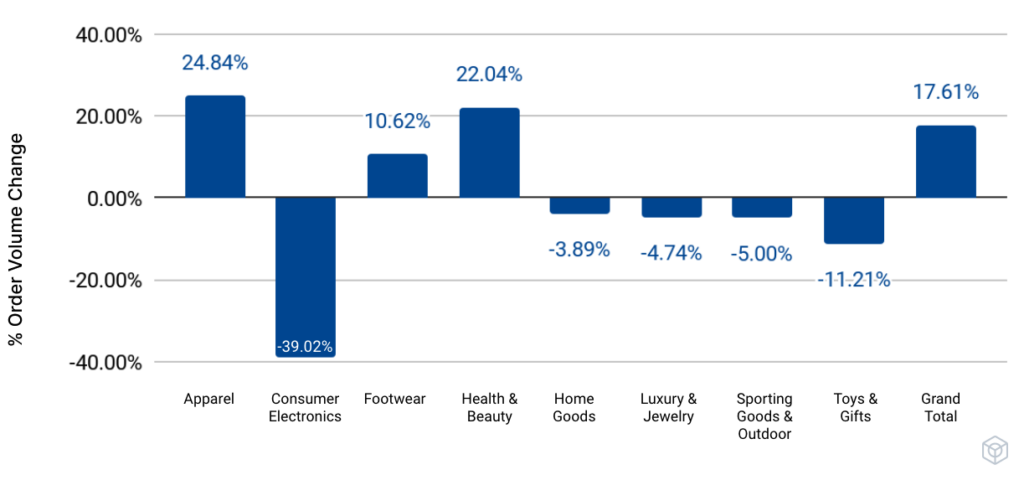
How Black Friday Order Volume Changed Year-Over-Year
How Black Friday Average Order Value Changed Year-Over-Year
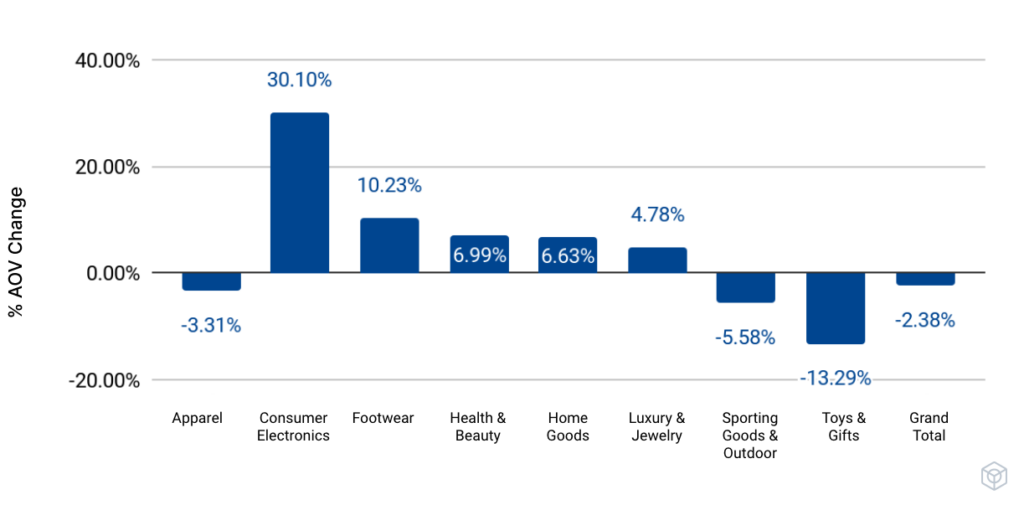
With the unofficial holiday season beginning earlier and earlier, Black Friday is no longer considered the day for shopping for many consumers. Overall, we saw the number of orders increase by 18%, while average order value decreased by 2%.
In other words, people made plenty of purchases on Black Friday; they were just cognizant of how much they spent. Significant discounting also impacts average order value.
Because of inflation, NerdWallet’s annual holiday shopping survey found that 56% of holiday shoppers weren’t planning to buy as many gifts as they would have liked. Similarly, retail category analysis demonstrates a potential shift to consumers stockpiling essentials.
With apparel, footwear, and health and beauty categories having increased order volume, our hypothesis is that consumers are buying items for themselves to stockpile at the best possible price. During the early 2000s recession, Leonard Lauder, chairman of the board of Estee Lauder, coined the term “lipstick index.” The idea is that during times of economic uncertainty, people buy more beauty products — as opposed to pricier items.
Shoppers potentially stocking up on essentials would also explain the decrease in order volume across categories like toys and gifts, and consumer electronics. Of any category, toys and gifts experienced the sharpest decline in average order value. For apparel retailers, order volume was up while value was down, speaking to that particular vertical’s deep discounting.
How Many Products Shoppers Viewed on Black Friday — and How Many Times
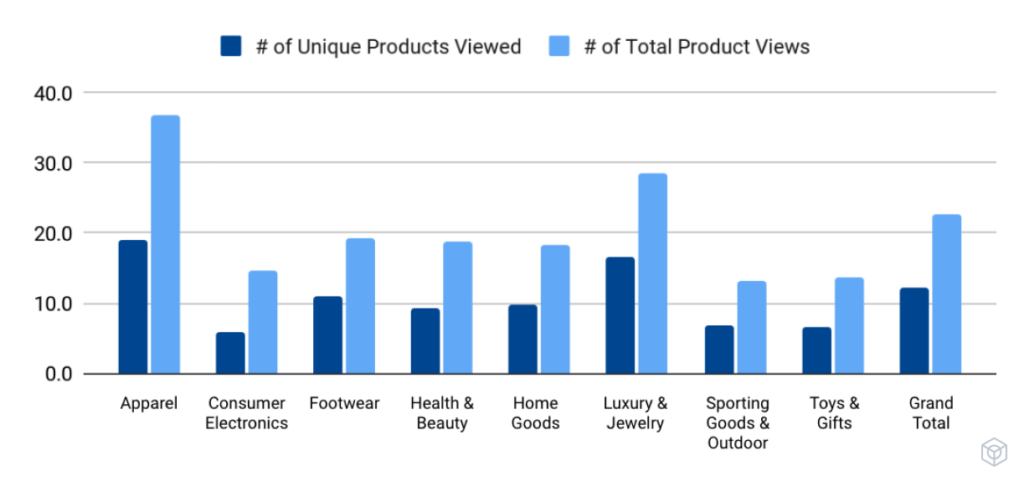
Considering 91% of consumers read product reviews, research is a key part of today’s fluid customer journey. Our Black Friday data found that consumers viewed an average of 12 unique products, but their total product views were 23. This demonstrates a high level of consideration for any purchase. In apparel, for example, consumers viewed a large number of unique products (19) and total views were 38 ahead of purchasing. This was similar to where luxury and jewelry weighed in, suggesting that in this economy, consumers are treating every dollar with care.
How the Number of Product Views on Black Friday Changed Year-Over-Year
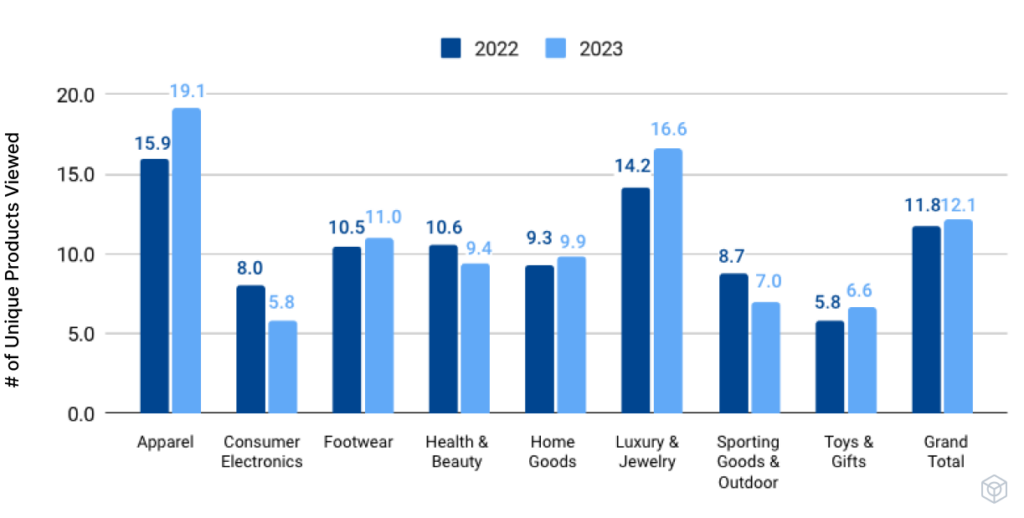
Economic factors have heightened that. As people look to get a bigger bang for their buck, they’re spending even more time on purchase consideration than they did last year. Looking to spend less, shoppers had a plan of attack.
Apparel racked up the most product views as well as the biggest increase year-over-year. This supports our hypothesis that Black Friday shoppers were stockpiling staples. They may be more inclined to do more research to ensure it’s the right fit. Shoppers also viewed luxury and jewelry products more than average, likely putting more thought into bigger ticket purchases.
This increase in product views only highlights the importance of identification, which is crucial for retailers to capitalize on moments of intent. Examples include deploying onsite email capture to grow their lists and sending abandonment messaging to jog their browsers’ memories.
Black Friday Customer Movement
Key Insight: Large enterprise retailers experience a greater majority of purchases coming from repeat shoppers compared to their mid-market peers, showing more investment in overall retention.
Customers are always moving in one of two directions: toward retention or toward churn. Though everyone hopes for the former, the latter is inevitable.
Retailers should have a plan in place for moving unidentified shoppers to known customers to repeat buyers. We call that plan a Customer Movement strategy, which is a must for achieving quarterly revenue, annual growth, and profitability.
Retention is central to Customer Movement; prioritizing a strategy here has helped retail leaders see 4-12x increases in retention. It’s especially important given the economic uncertainty that has consumers more conscious of their spending this holiday season.
Media budgets are increasingly being cut, which means owned channels drive sales. Throughout October, we’ve already seen retailers respond to decreases in orders — both how many and how much — and lean into their existing customer base.
How Black Friday Repeat Purchase Rates Changed Year-Over-Year
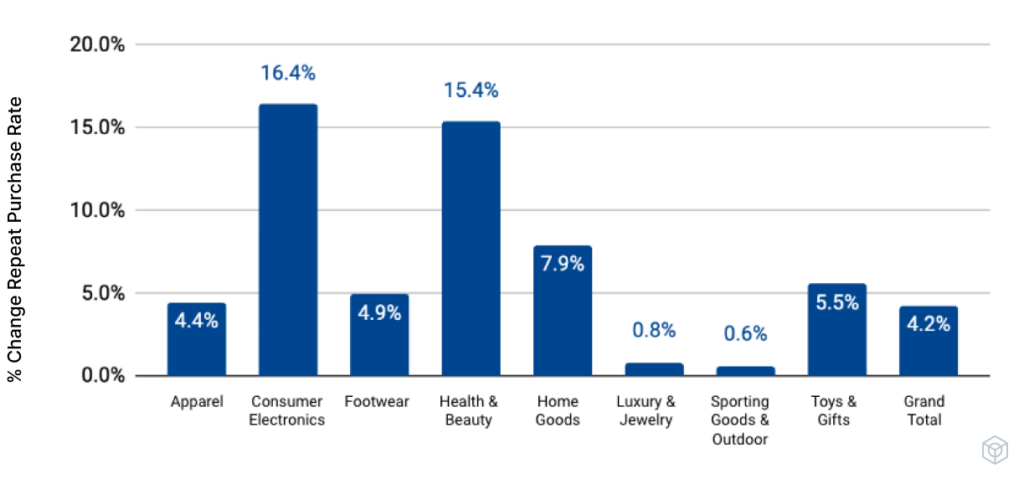
Black Friday trends also moved in that direction. Compared with last year, retailers saw 4% more repeat shoppers, given their focus on retention in light of rising customer acquisition costs and decreasing demand. On the consumer side, price-consciousness has many people predictably sticking with those brands they know rather than experiment with new ones.
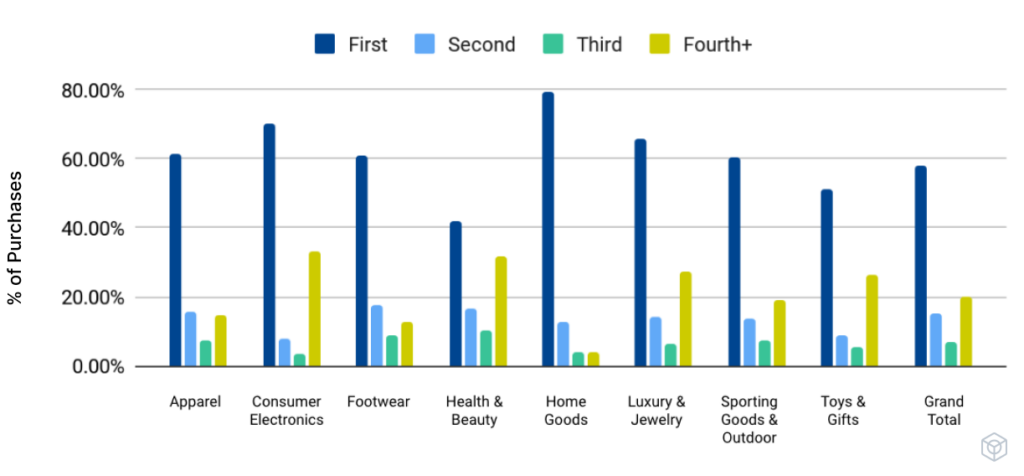
Consumers have different shopping patterns, both product- and category-wise, while they search for holiday gifts. Retailers tend to see a lot of first-time shoppers and our Black Friday data confirmed that. Overall, 53% of purchases came from first-time shoppers: the biggest segment. The next largest segment was those Black Friday shoppers who have made at least three prior purchases, representing 32% of overall shoppers.
Percentage of Black Friday Purchases by Buyer Type (Mid-Market Retailers)
Percentage of Black Friday Purchases by Buyer Type (Large Enterprise Retailers)
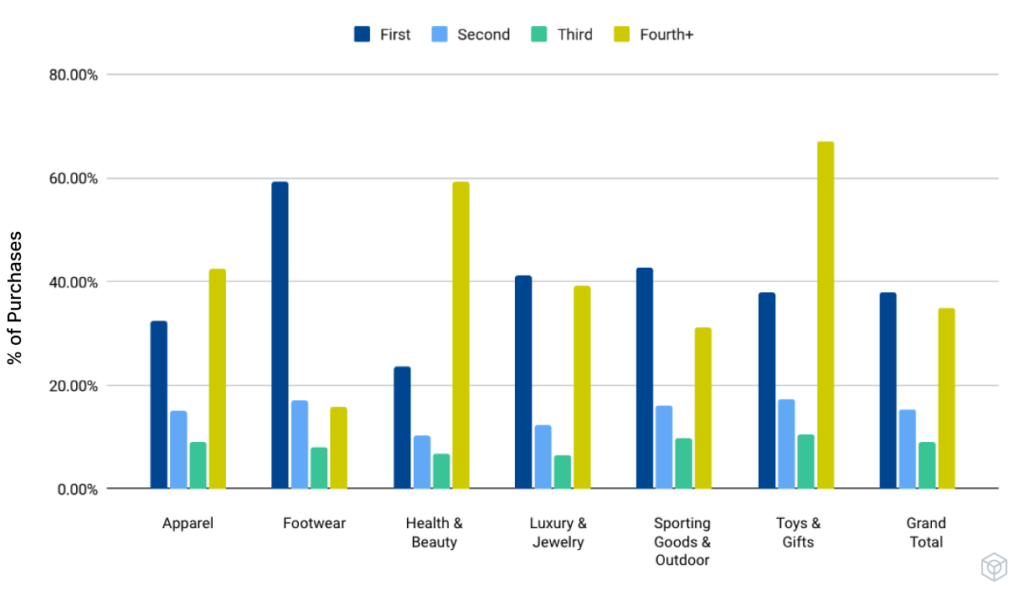
Breaking down buyer types by large enterprise and mid-market retailers, those numbers look a bit different. For the smaller brands, first-time buyers represented 58% of Black Friday consumer spending while those who have purchased three or more times were 27%.
By comparison, large enterprises saw significantly fewer first-timers (38%) and far more loyalists. Their share of shoppers who have purchased at least three times was 44%
Percentage of Newly Identified Customers Who Bought During Black Friday Week
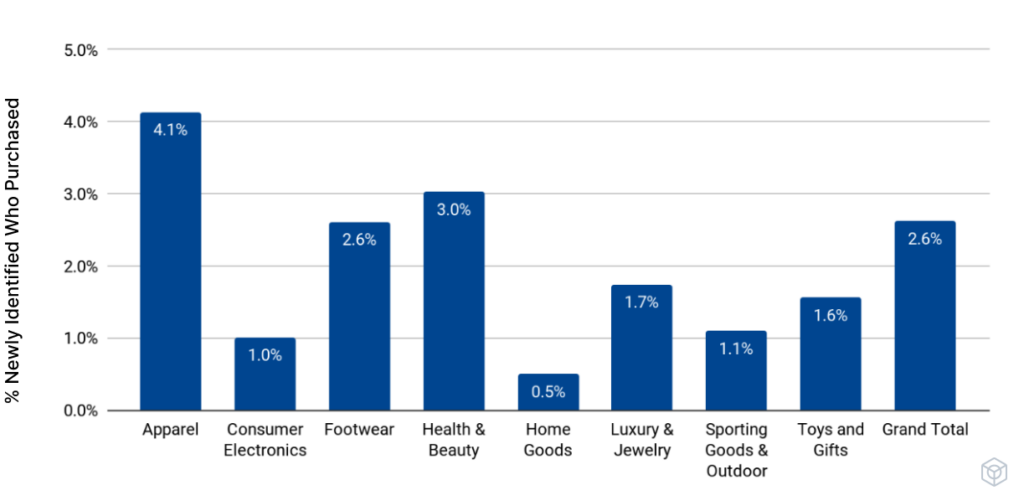
We can’t ignore the connection between identification rate and loyal customer bases. Overall, 2.4% of recently identified shoppers made purchases during the week of Black Friday. This was especially high in apparel, and health and beauty — categories that lend themselves to strong customer lifetime value.
If a shopper loves a particular apparel brand, for example, there are endless opportunities to nurture loyalty: complementary items, different categories, new clothes for a new season, and the list goes on. Meanwhile, health and beauty brands offer product- and category-level recommendations and replenishment opportunities.
Large enterprises have a greater pool of resources to draw on for more complex use case execution. They also have a greater focus on the integration of technologies across their ecosystem to use data from one to augment others, as well as more mature programs for loyalty, which are known to increase identification rates.
These numbers demonstrate why retention should be top of mind for every retailer not only during the holiday season, but throughout next year.
Black Friday Campaign Performance
Key Insight: The best performing campaigns included layers of personalization — from onsite personalized product recommendations to shopper preferences to lifecycle stage — accounted for in email messaging, creating hyper-relevant moments for customers to take action.
Something different we did this year was look not just at shoppers’ purchase patterns, but what prompted them. The modern customer journey is fluid, with little distinction between channels. Different channels represent individual pieces of the same puzzle, with site, email, mobile, and even the in-store experience all working together.
Click-to-Conversion Rate of Site Campaigns on Black Friday
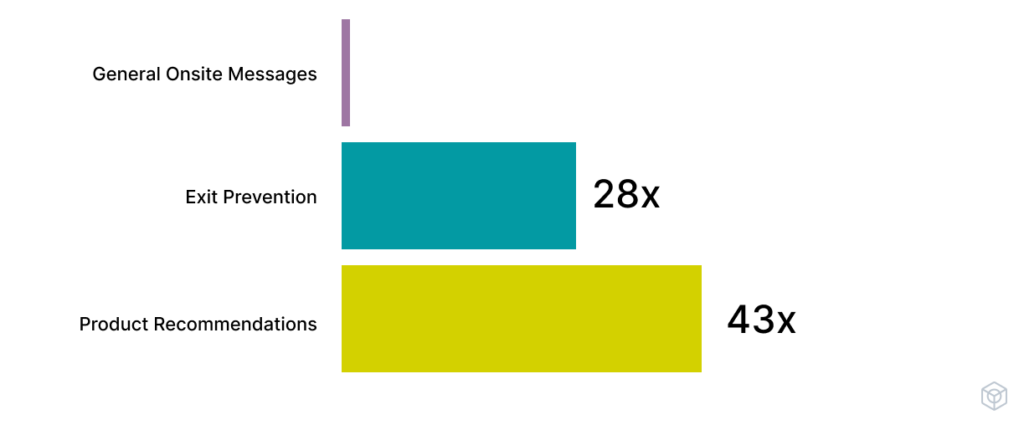
We analyzed Black Friday data across various site and email campaigns as they’re the most mature, dependable digital channels. On the site side, Product Recommendations were particularly successful, converting 43x more shoppers than General Onsite Messaging and nearly 28x more than Exit Prevention. This wasn’t a surprise given that recommendations this year’s Black Friday trends pointed to high purchase consideration.
Recommendations are also very versatile. New shoppers are unfamiliar with a brand and may not know where to begin. Onsite Product Recommendations are a great introduction, letting people know what’s hot and trending, or even simply what’s available. At the same time, onsite Product Recommendations enable retailers to get more personalized with those shoppers they do know.
Email Capture Rate of Site Campaigns on Black Friday
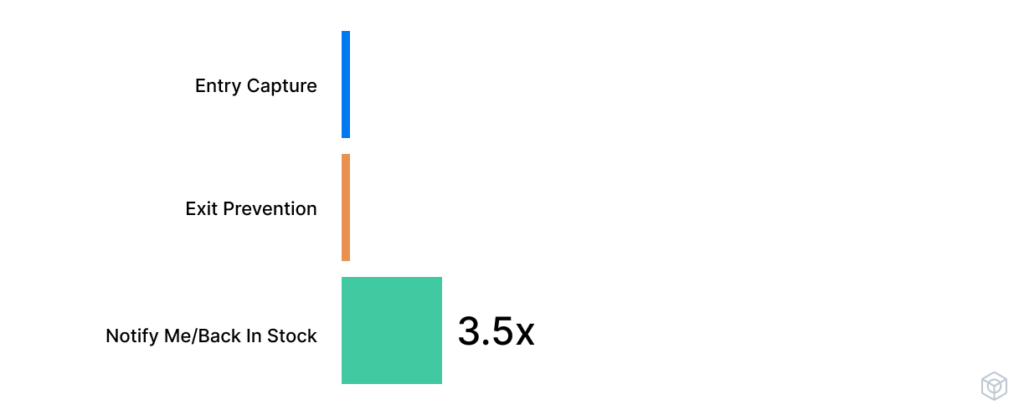
Some site campaigns are meant to convert. Others are for capturing email addresses, which builds brands’ identification rates. Notify Me/Back in Stock campaigns were the clear winner, capturing 3.5x more emails than the general Entry Capture modal. That’s a huge win for retailers of all sizes.
When people sign up for notifications, they’re providing valuable data about their purchase intent as well as their preferences, which can power future personalized messaging and give a retailer the ability to immediately offer similar products that are in stock to spark conversion at the moment of intent.
Conversion Rate of Triggered Email Campaigns
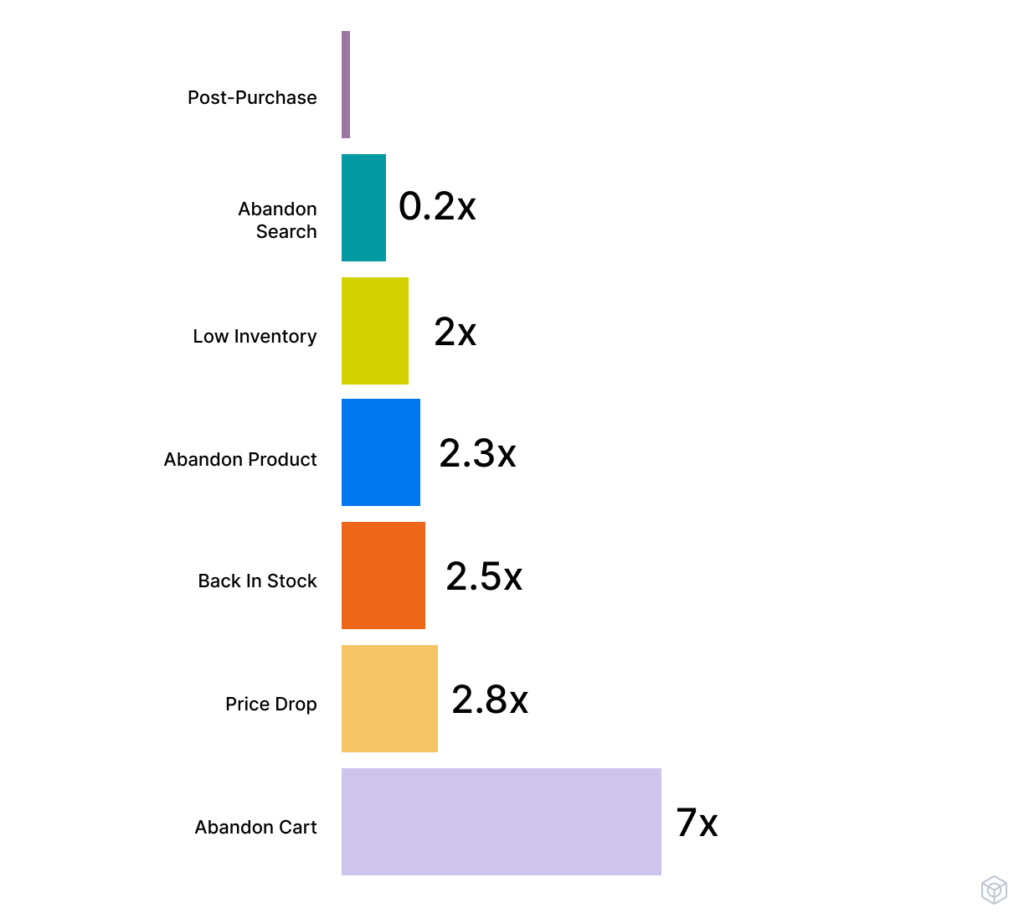
Back in Stock notifications also performed well in the inbox, ranking third among all triggers on Black Friday. Sent in response to specific customer actions, triggered messages are effective revenue and profit generators — holiday season or not.
Consistent with our year-round benchmarks, Abandoned Cart was the top trigger by far.
While abandoning a cart may seem like a sign of disinterest, it’s anything but. Carts increasingly double as wishlists or even to-do lists. Today’s customers know that abandoning one will almost certainly prompt an email, which can serve as a reminder to check out later… especially if there’s an incentive.
Price Drop notifications were a distant second. These merchandise triggers tend to perform year-round partially because they don’t go out to just anybody. These messages are reserved for those shoppers who have previously searched for, viewed, carted, or have a predicted affinity for a particular item. Those strong interest indicators only increase with a decrease in price.
On the other hand, Black Friday trends showed Post-Purchase emails to be the lowest performing trigger. That makes sense as they tend to be more of a bigger picture tactic. Every subsequent purchase a customer makes with a brand increases the likelihood they’ll buy again. While post-purchase emails are a no-brainer for brands looking to turn happy customers into repeat purchasers, they’re more likely to inspire a later action — such as leaving a review — than an immediate conversion. This is doubly true if that first purchase was relatively recent.
Conversion Rate of Proactive Personalized Email Campaigns
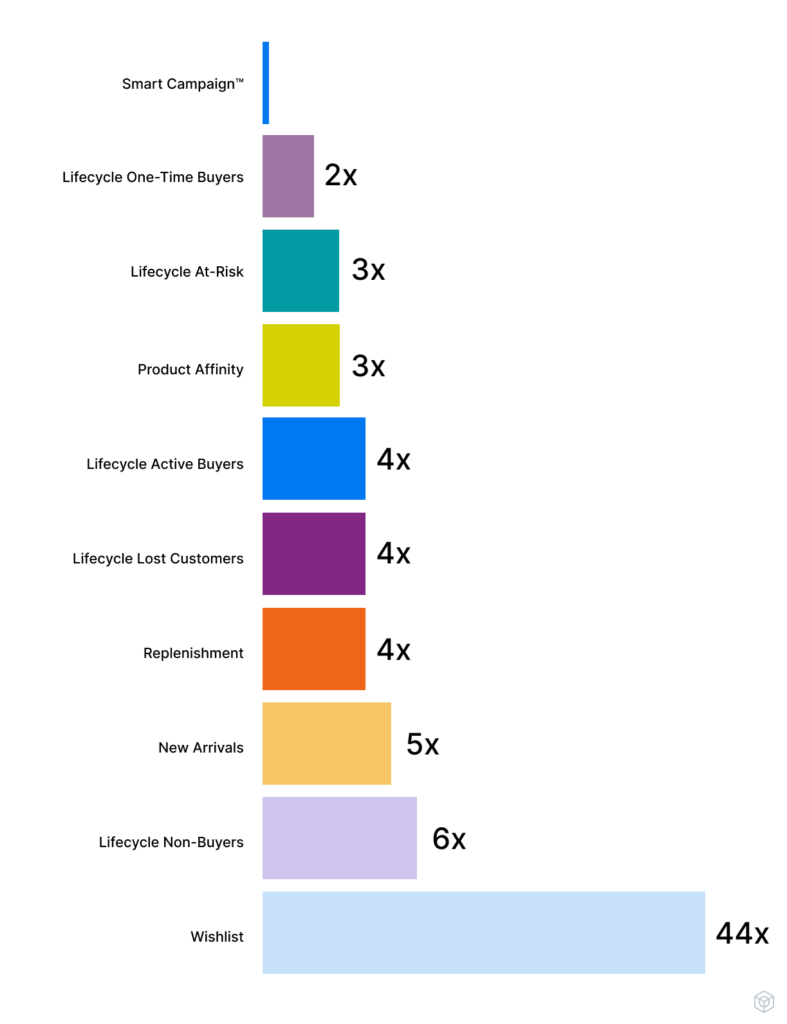
Where triggers are reactive, proactive personalized campaigns are dynamic and unique to every shopper. Among those messages, Wishlists unsurprisingly took the gold, which tracks with the high consideration we saw across consumers in the data.
Black Friday data showed the lowest conversion rates among Smart Campaigns™. While these recurring campaigns deliver unique content, offers, and recommendations to each customer, they aren’t segmented like other proactive personalized campaigns. They go out to everyone regardless of where they are in the purchase journey, so that makes them a bit less targeted by comparison.
What You Can Do Next
Join our upcoming community events where you’ll learn how to adjust your strategies based on these trends.
If you’re a VP+ executive, our DTC Collective community is the place to be. Join your peers at our December roundtable to discuss how to use these insights to mitigate risk, and accelerate growth opportunities to bring back to your marketing team for 2024 planning. (Disclaimer: Due to the exclusivity of this community, not all applicants will be accepted for DTC Collective events.)
If you’re a Manager or Director, the Coffee & Commerce community meets monthly and is full of talented retail practitioners, and accepts members of all levels. For our December roundtable, we’ll discuss how to translate these insights into actionable campaigns and messaging strategies for the remainder of the year and into 2024.
Connect with us 1:1, if you’re interested in receiving a Retail-Strategist led Customer Movement Assessment — a full analysis of your retention health and revenue opportunities compared to your peer group — reach out to Sarah Cascone, VP of Marketing, at sarah@bluecore.com.
Methodology
Bluecore derived the following data on Black Friday from 68,646,309 first-party cookies, 911,239,468 shopper events, 6,997,566 unique products, 10,014,908 orders and $1,264,344,495 in total sales across 161 retail brands: 57 apparel, 10 consumer electronics, 15 footwear, 12 health and Beauty, 10 home goods, 16 jewelry and luxury, 24 sporting goods and outdoor, and 17 toys and gifts.
These insights are derived from Black Friday UTC (7PM EST Thursday, November 23 through 7PM EST Friday, November 24).
How site traffic has changed from Black Friday 2022 and a typical day in 2023
62 retailers have < 20,000 cookies onsite on a typical day (‘smaller’), 46 retailers have between 20K-100K cookies onsite on a typical day and 46 retailers have > 100K people onsite on a typical day in 2023. A session represents a 30-minute period of onsite activity, regardless of the actual time spent on site. Industry benchmarks are calculated as the change in total session volume per each industry as a whole. As such, larger retailers have a more significant impact on industry trends.
Breakdown of repeat buyers retailers brought back to buy on Black Friday
The percentage of first-time, second-time, third-time, fourth + time buyers on Black Friday 2023 was calculated for all brands with a minimum of 24 months of continuous shopper history. Fourth+ time buyers is an aggregate of all shoppers who have made four or more purchases with a brand.
Change in buying trends from Black Friday 2022 to Black Friday 2023
The percentage of first-time, second-time, third-time, fourth+ time buyers on Black Friday 2023 was calculated for all brands with a minimum of 24 months of continuous shopper history, and the proportion was compared to the proportion of shoppers on Black Friday 2022. Fourth+ time buyers is an aggregate of all shoppers who have made four or more purchases with a brand.
Number of shoppers that returned to a retailer they first discovered from this year
We calculated the proportion of buyers who made their first purchase with a brand between January 1, 2023 and October 31, 2023 and purchased again in the early holiday season, defined as November 1, 2023 through Black Friday (November 24, 2023).
How many times shoppers viewed products before completing the purchase
Average number of products viewed: average number of distinct products (as calculated using the product id field) viewed in the month prior to Black Friday.
Average number of views: average number of unique products viewed in the month prior to Black Friday (a single product can be viewed multiple times).
Proportion of Black Friday shoppers that viewed: the proportion of all the customers who made a purchase online on Black Friday that viewed a brand’s product at least once in the 30 days prior.
How average order values and total orders have changed from Black Friday 2022
We calculated the volume and average order value (revenue / orders) of Black Friday shoppers who placed an order on November 24, 2023, and compared it to the volume of shoppers who placed an order on November 25, 2022. Industry AOV changes were computed as the total revenue for that industry divided by the total orders for the industry, and the year of year change was calculated from this value. As such, larger retailers have a more significant impact on industry trends.
Change in average order value from first through fifth time shoppers
We calculated the average order value of shopper’s orders, broken out based on the number of purchases a person has made with the brand before. Any purchase made beyond the fourth purchase within a brand is grouped with the fourth purchase group for visualization purposes.
Shoppers that moved from anonymous to identified on Black Friday
We calculated the portion of cookies on site that were associated with an email address for the first time on November 24 2023, and compared that to cookies that were not identified, and those that had been identified on a prior date.


