


Bluecore’s 2025 Customer Growth Benchmarks Report
Metrics for Identification, Conversion, and Retention in Retail

Retail has never been more challenging. But at the same time, retailers are already familiar with reorienting their strategies to thrive in volatile markets. The most successful retailers know that customer movement is the path to profitability, even amidst rising acquisition costs and low consumer confidence.
Customer movement is the practice of understanding customer value and using signal-based strategies to move shoppers through the lifecycle from first-time visitors to faithful buyers.
To understand customer value is to think outside the channel. Channel metrics, such as opens and clicks, are important. But they’re at their best when used as a barometer and driver of customer metrics, such as retention and reactivation rats.
Bluecore data shows that retailers focused on channel-led growth see an average three-year customer retention rate of 22%. On the other hand, retail leaders who have embraced customer movement see an average three-year customer retention rate of 59%.
Bluecore’s 2025 Customer Growth Benchmarks Report: Metrics for Identification, Conversion, and Retention in Retail is meant to help you become one of the latter and understand your greatest opportunities on the road to profitable growth. Ours is the only benchmarks guide focused on customer-led growth metrics, rather than channel-centric KPIs. Based on the entire 2024 calendar year, this report includes benchmarks from more than 100 retailers across seven different verticals: apparel, department stores, footwear, health and beauty, home goods, jewelry and accessories, and sports and hobbies.
Benchmarks are sorted by the four phases of the customer lifecycle:
- Acquisition, when unknown shoppers become identified
- Conversion, when non-buyers become first-time buyers
- Retention, when first-time buyers become active buyers
- Reactivation, when inactive buyers become reactivated

Acquisition: From unknown to identified shopper
The path to purchase is anything but linear.
Shopper identification is foundational to moving customers through the lifecycle. This is measured by identification rate, or the percentage of site visitors a retailer can identify by attribute, such as phone number or email address, and tie back to a customer profile.
A good rule of thumb is to aim to have as high an identification rate as possible. The more shoppers you can identify, the more you can reach with tailored, timely messaging to drive a purchase. Identification rates are variable based on factors such as a retailer’s vertical or average order value. Based on Bluecore’s retail customer base, an objectively good rate is between 40 and 70%.
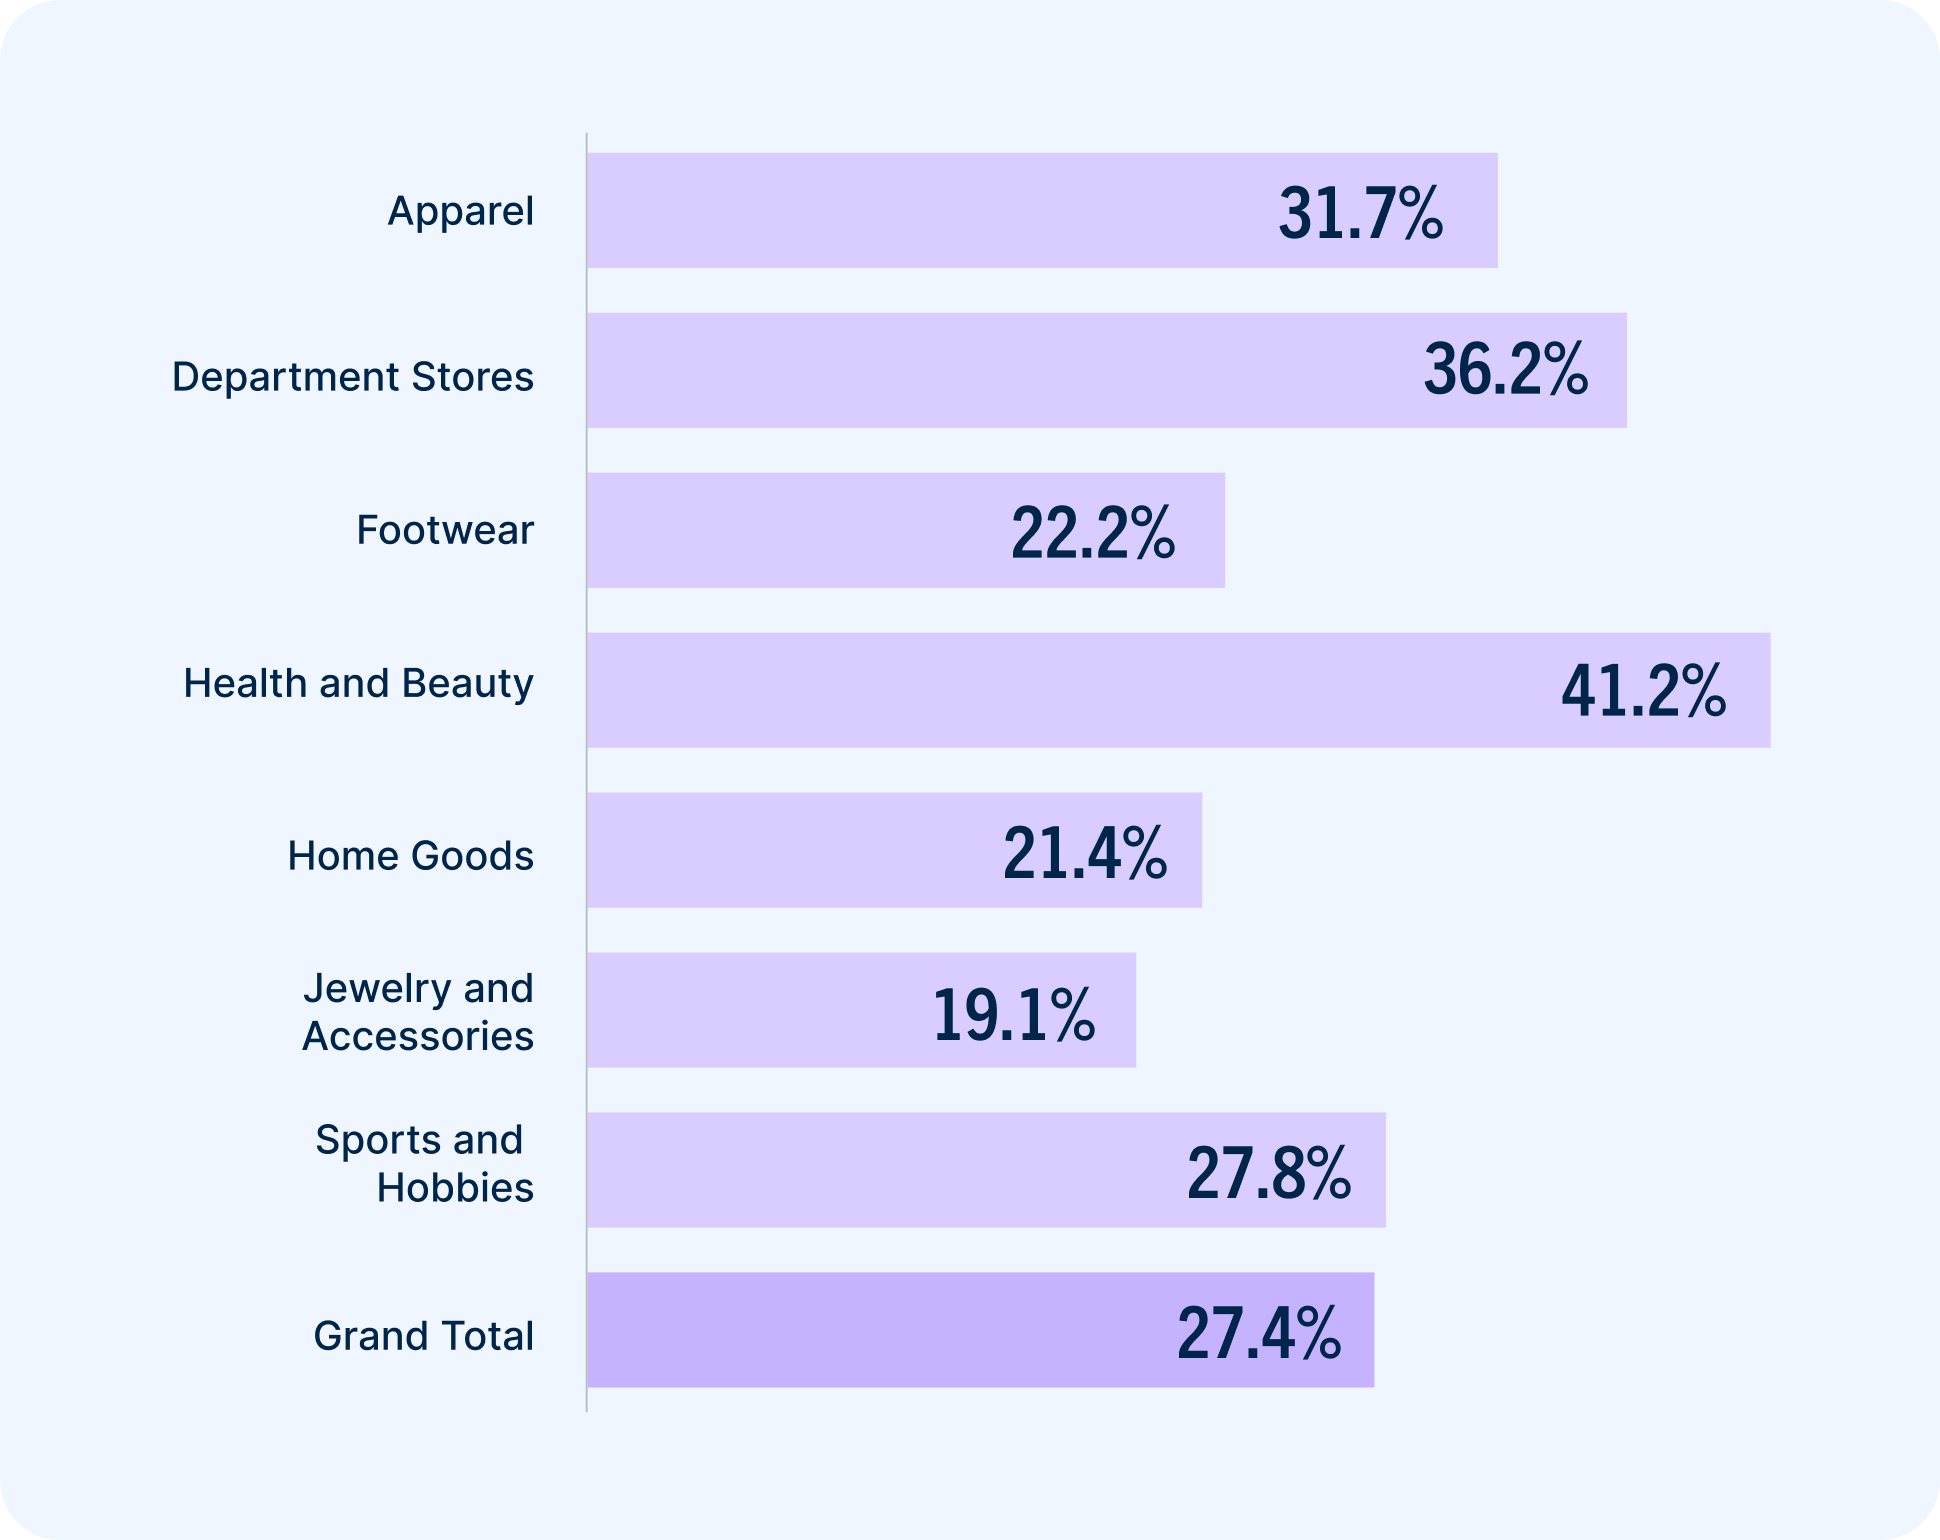
Across the board, retailers have made major strides in improving their identification rates. In 2024, the average brand was able to identify 32.5% of its shoppers, a 54% increase over 2023.
Identification rate: The percentage of shoppers retailers were able to identify
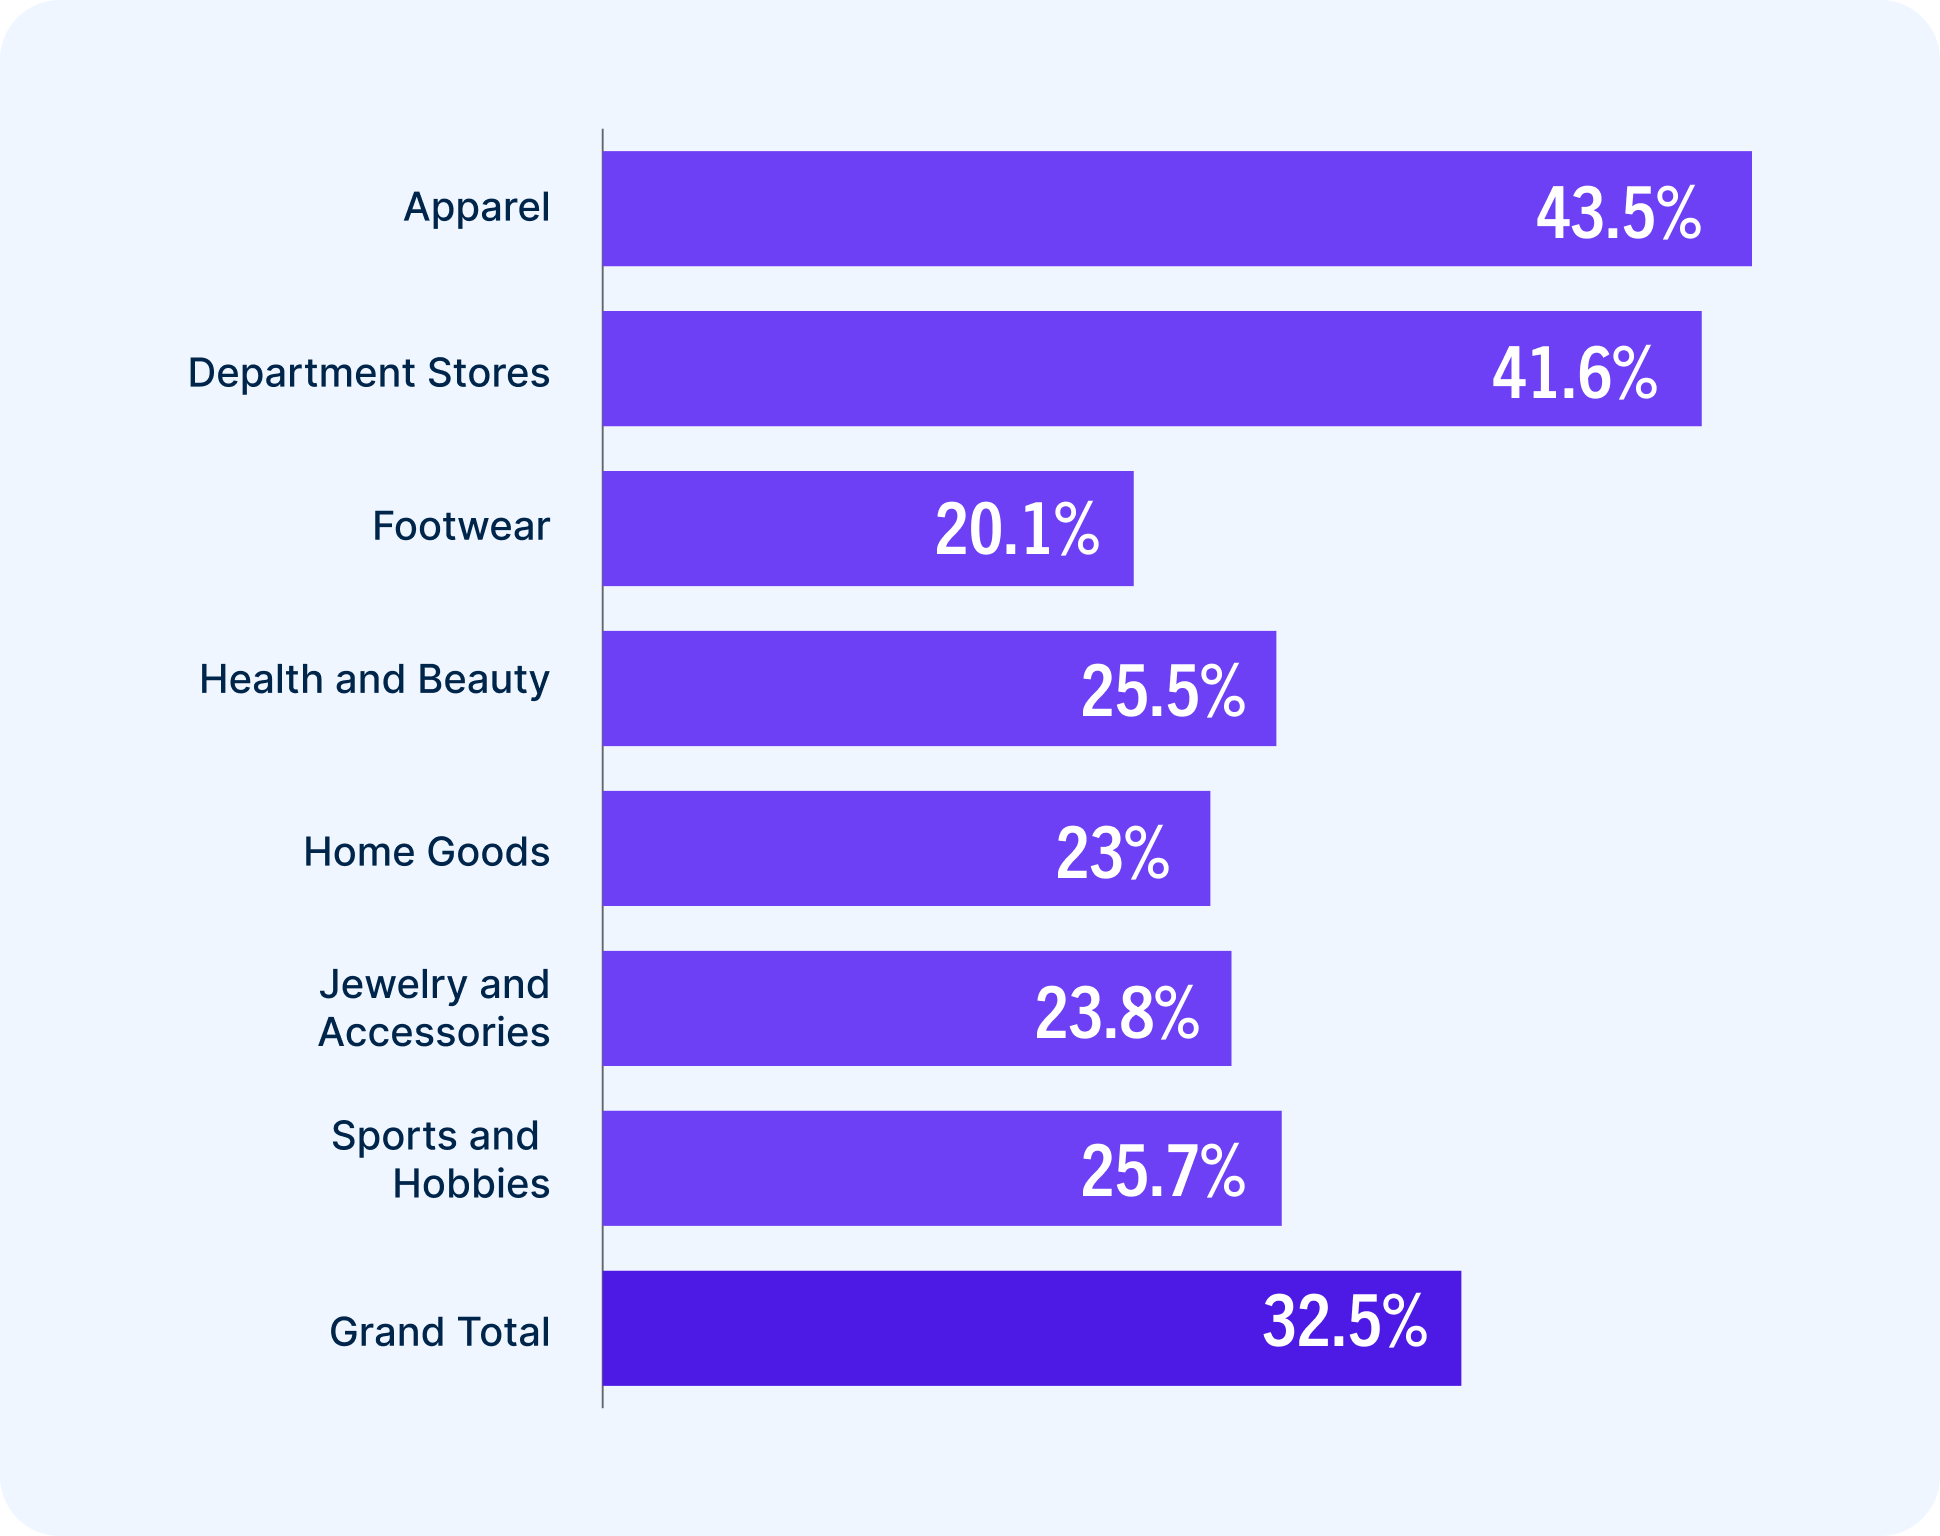
Apparel retailers and department stores led the pack by a fairly wide margin. These verticals lend themselves to a lot of “window shopping,” which is one factor. Another is that unlimited combinations of style, size, and color preferences may drive these retailers to prioritize strong identification.
Recognition and retention: Comparing the retention rates of retailers with the highest and lowest identification rates
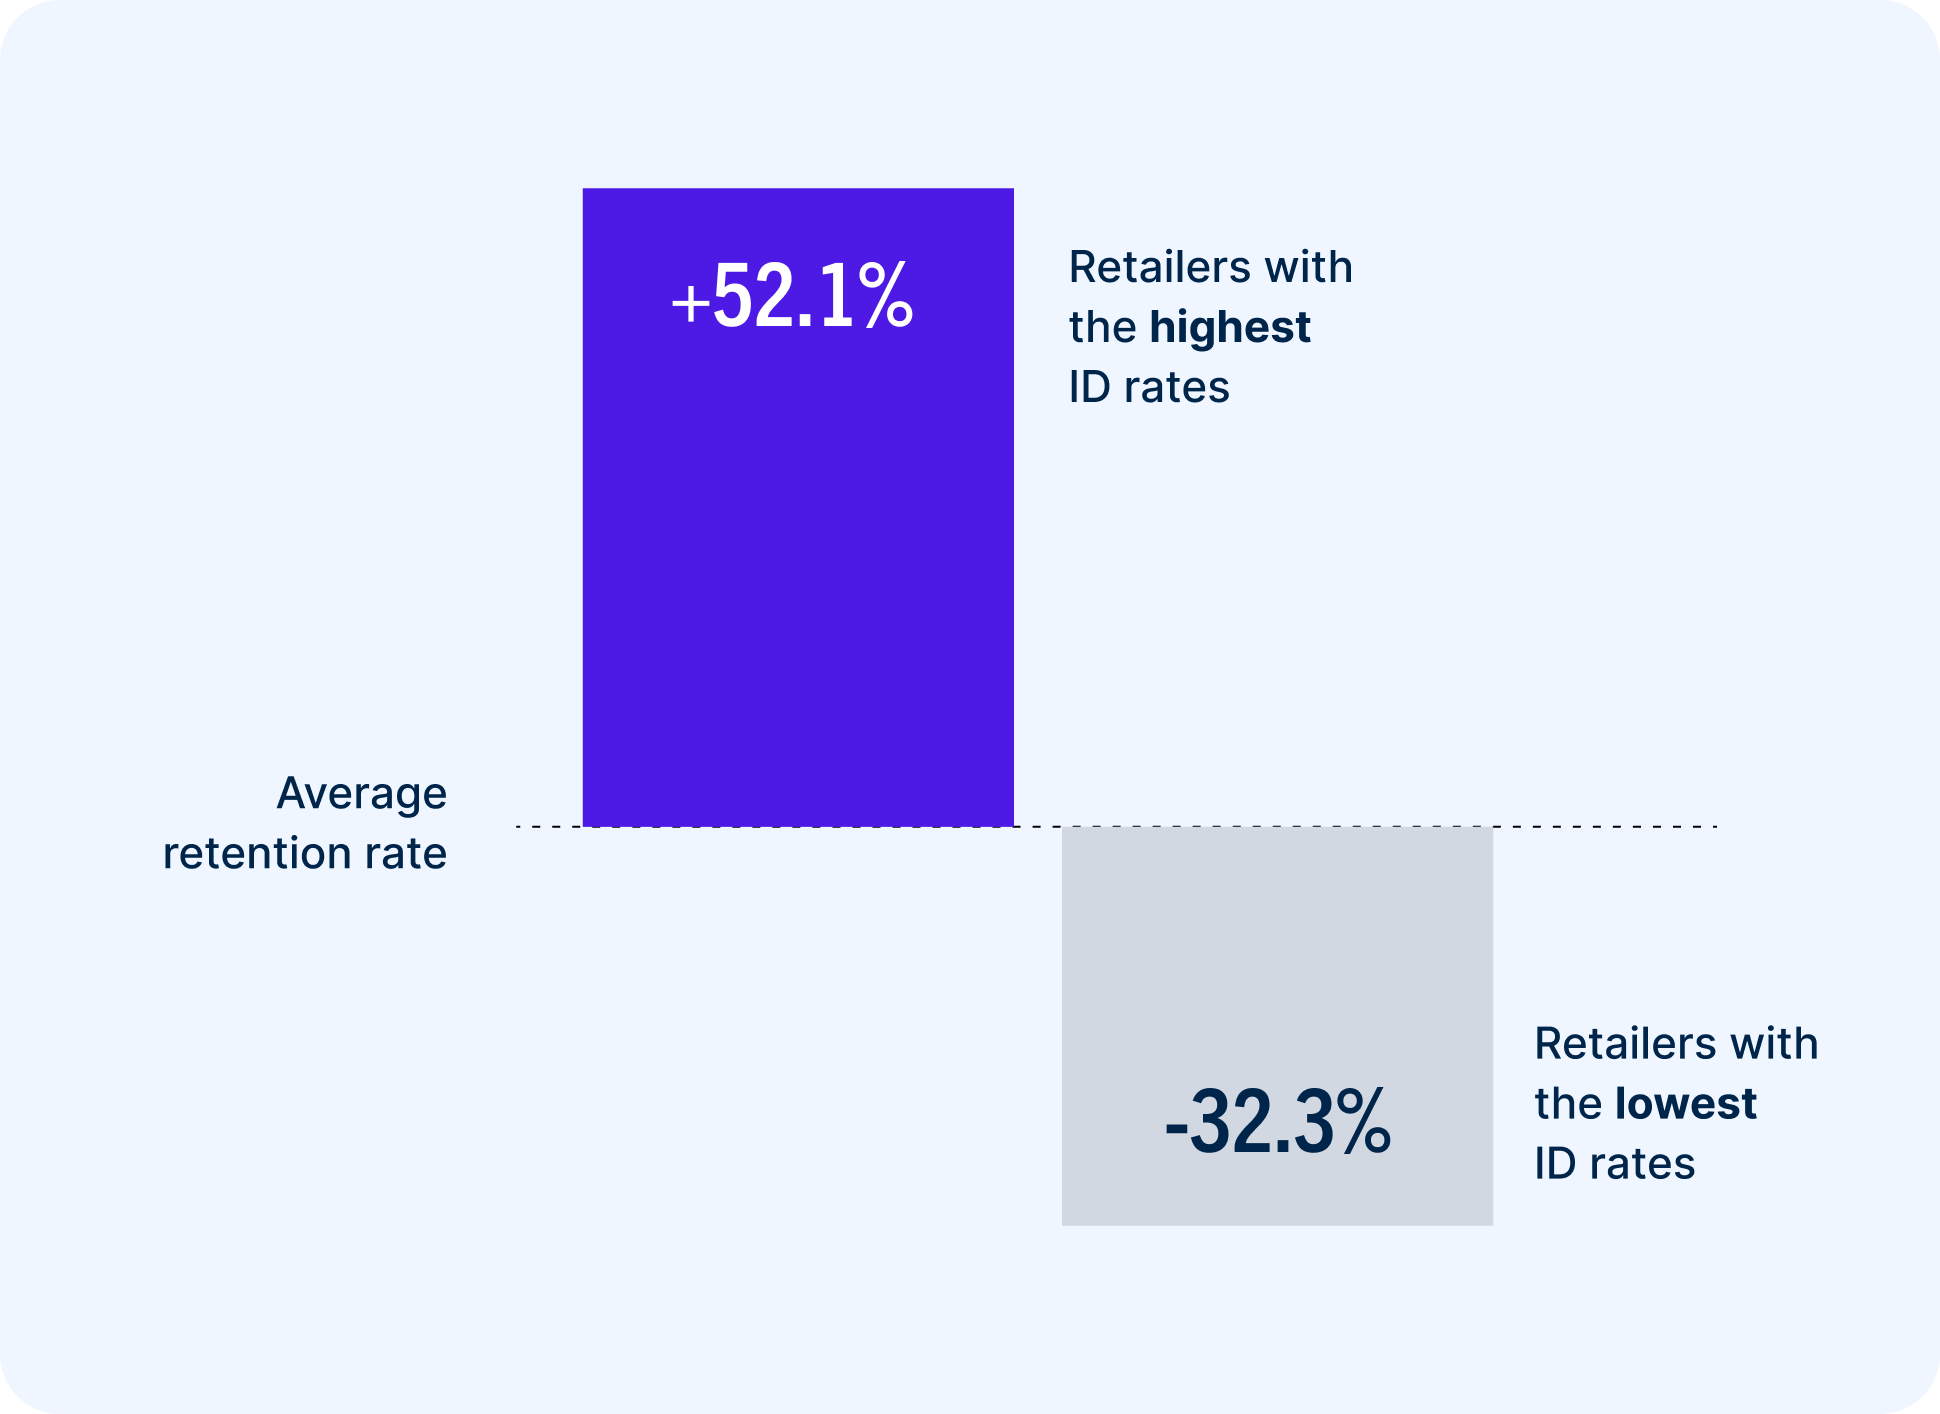
Retailers with the highest identification rates are better equipped to tailor the shopping experience based on shoppers’ preferences and behaviors to drive repeat buying.
We found a strong correlation between identification and customer retention. The 10 retailers with the highest identification rates, averaging 57.9%, saw significantly higher retention rates than other brands.
This comparison is especially stark with the 10 retailers with the lowest identification rates. Identifying just 9.1% of their shoppers on average, those brands also lagged in retention rates.
Increasing identification: The click rate of email capture campaigns
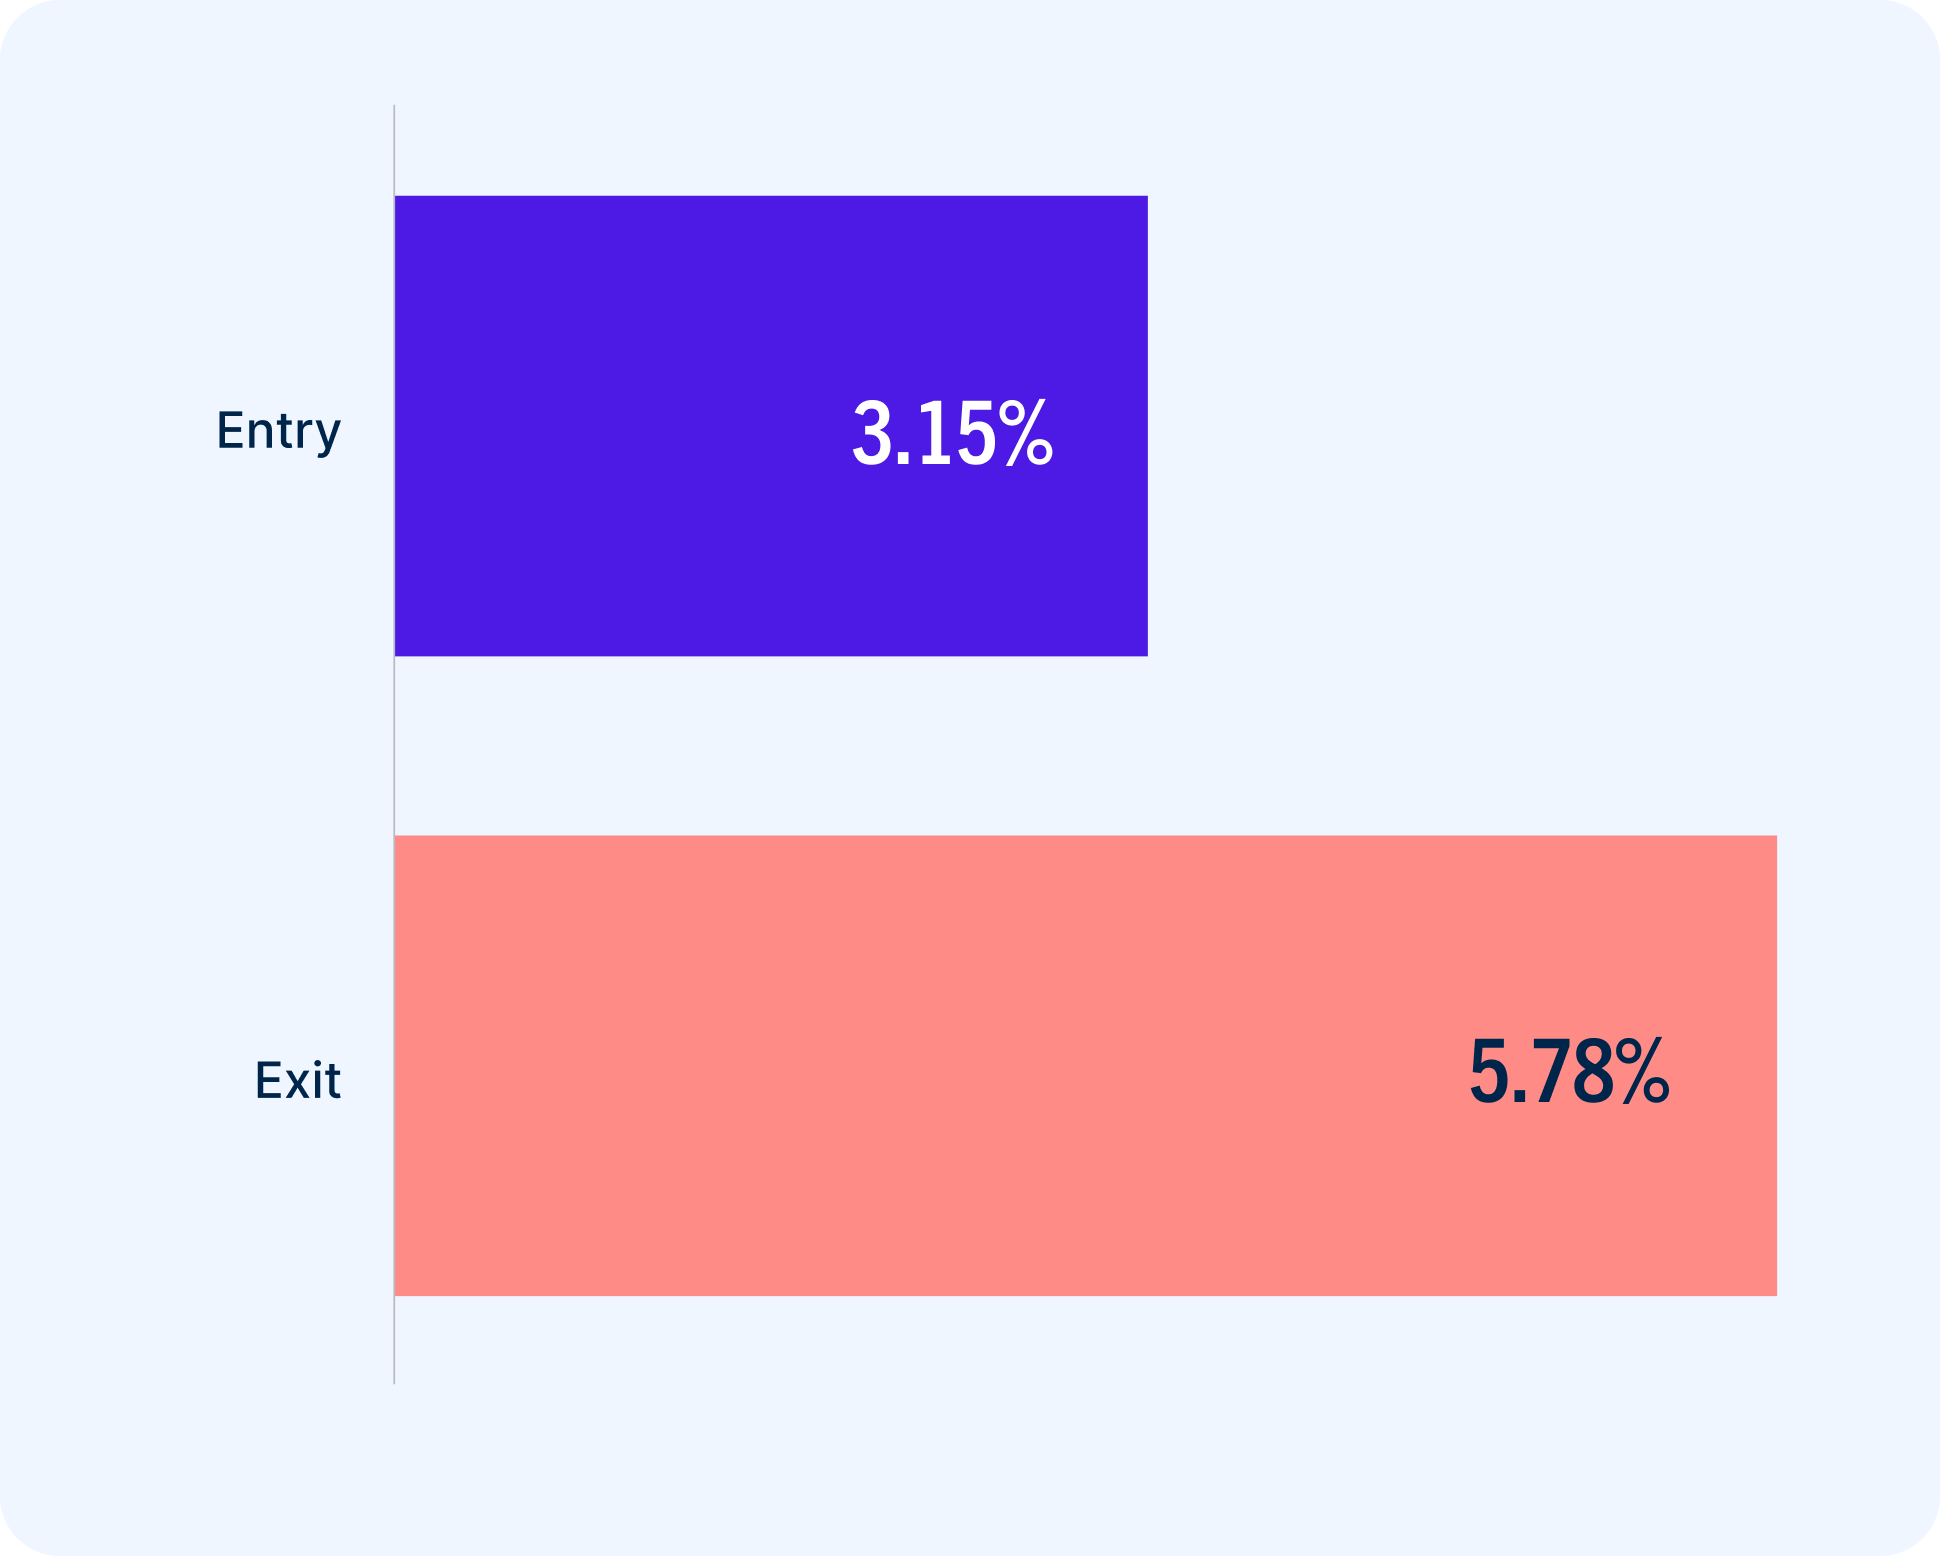
One way to learn who your shoppers are? Ask them.
Lead capture campaigns allow retailers to grow their lists and know their lists. These pop-ups, forms, and interactive elements prompt shoppers to share their email addresses. In 2024, Exit Capture was 83% more effective in doing so than Entry Capture.

Conversion: From non-buyer to first-time buyer
Every day, retailers send millions upon millions of emails. They’re all different but with the same goal: to turn opens into clicks and clicks into conversions.
Of course, it’s not that easy, but shopper identification does make it easier. When shoppers browse, they leave tons of signals about what they’re looking for and what they like. Behavioral signals are especially powerful when layered with product signals, such as whether an item is a new arrival or low inventory.
If you know who those shoppers are, you can use signal-based messaging to nurture that first purchase with highly relevant 1:1 campaigns.
Average order value: How much new customers spent
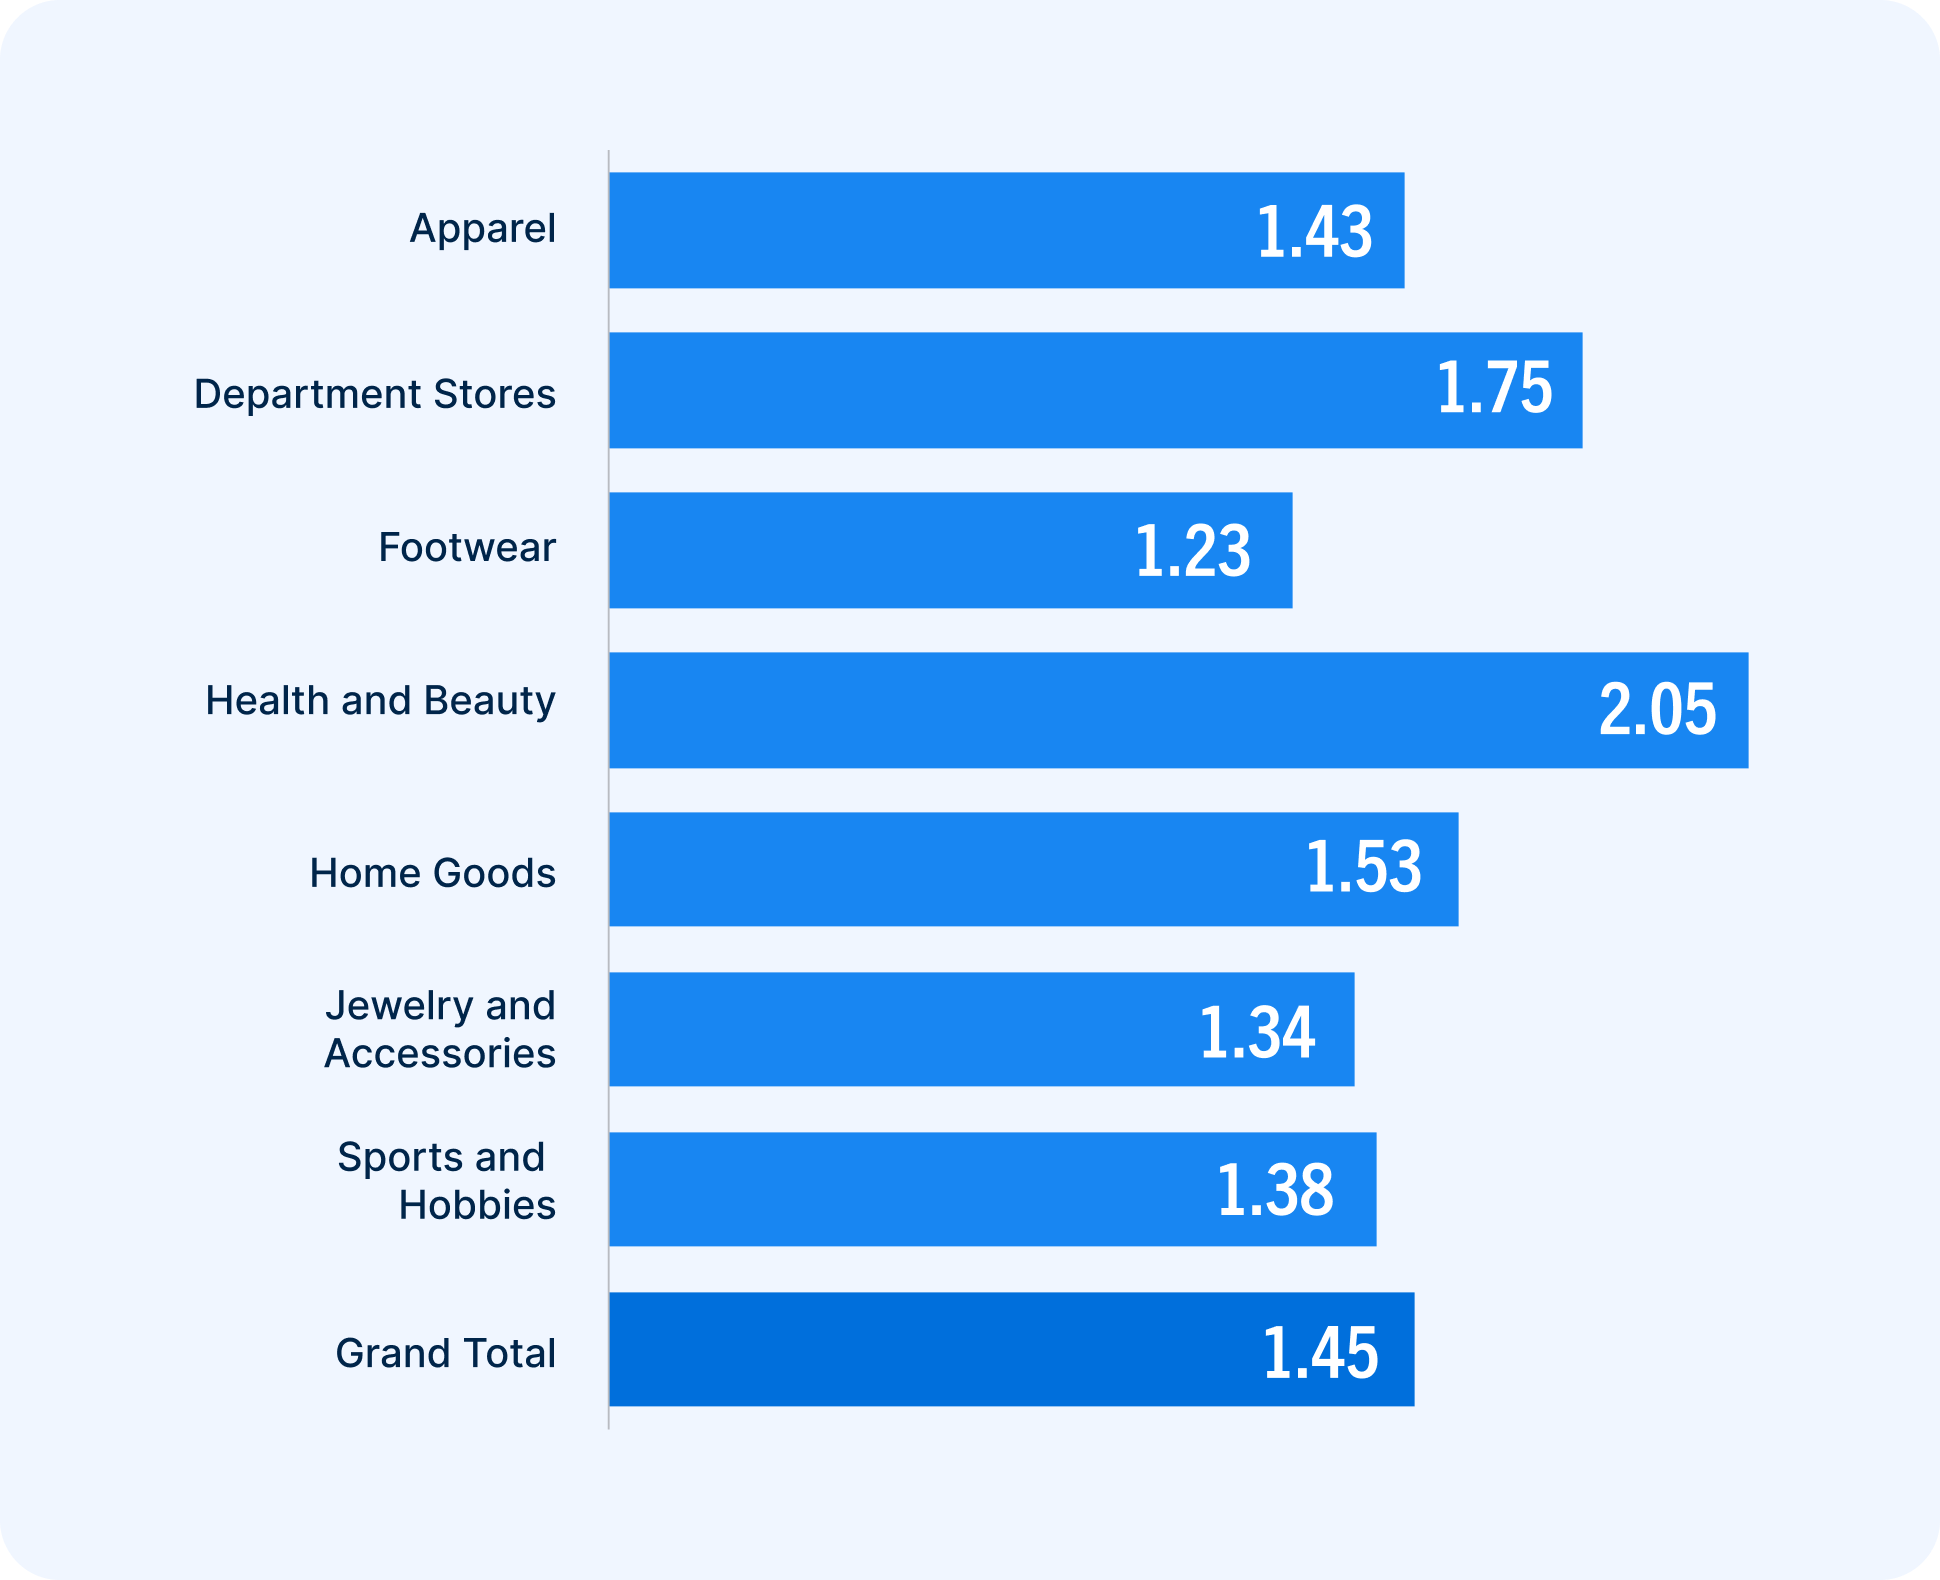
Purchase frequency: The number of orders per buyer during the first year
Average order values vary wildly, which is expected. Home goods, and jewelry and accessories naturally have higher price points than the majority of apparel, or health and beauty products.
Purchase frequency is much more linked with customer retention. This powerful metric is calculated by taking the number of a retailer’s orders per year divided by the number of buyers per year.
Health and beauty retailers, the leader, increased purchase frequency among new buyers by 34% from 2023 to 2024. This was the one vertical with an average above two purchases. For the most part, the rest were fairly consistent from one to the next.
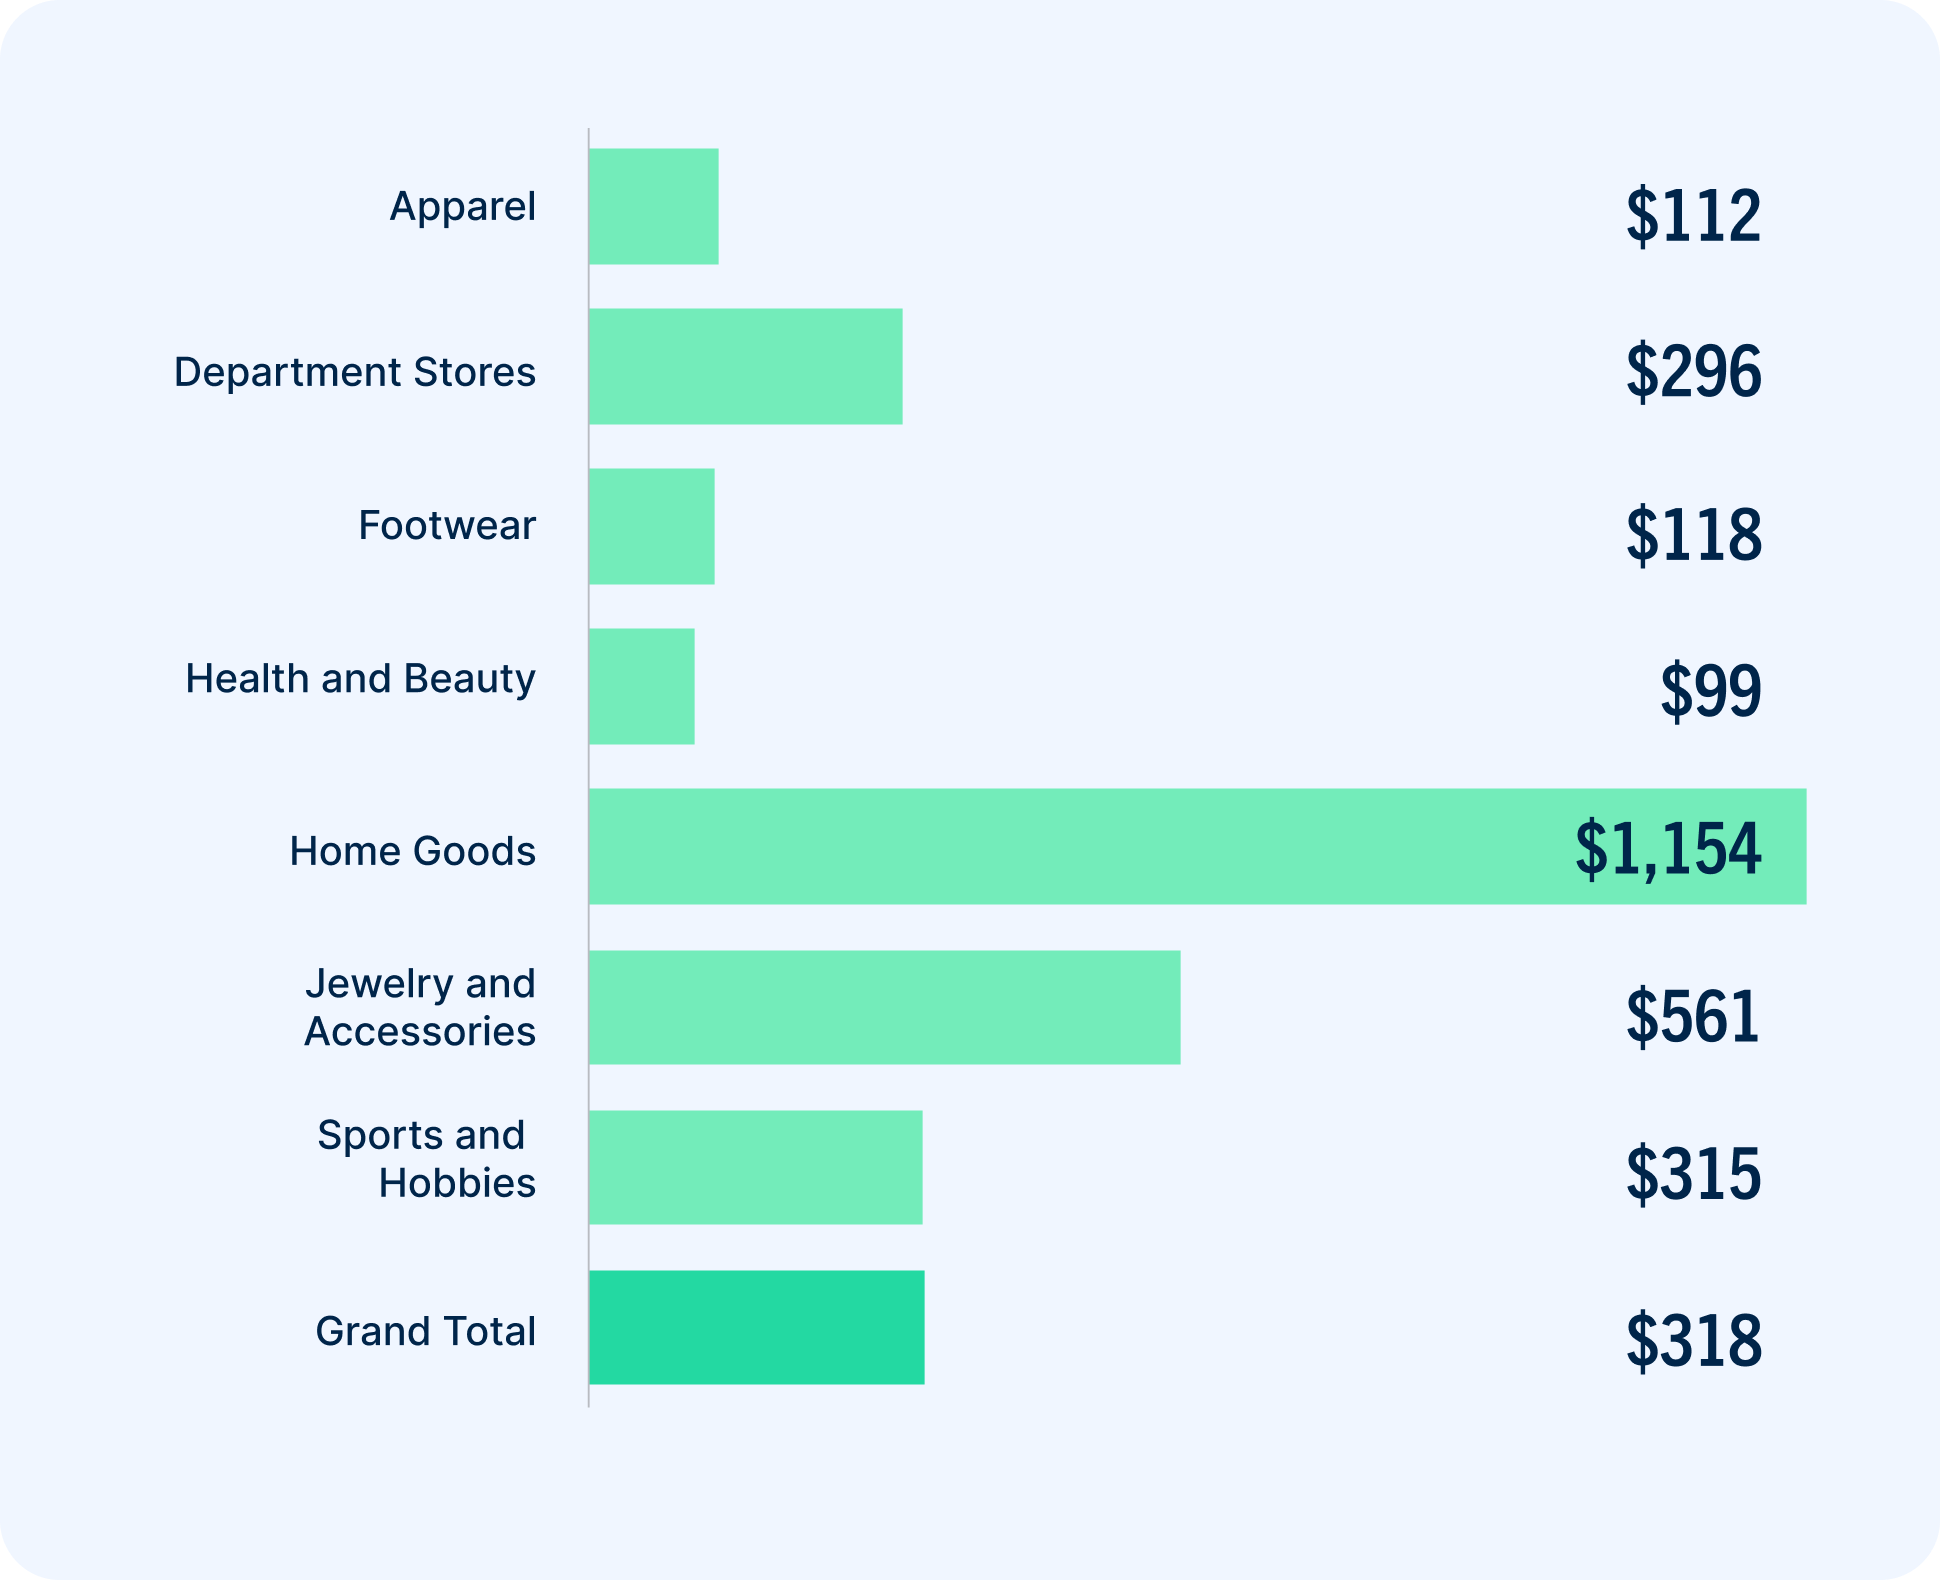
Sales per buyer: How much new customers spent during the first year
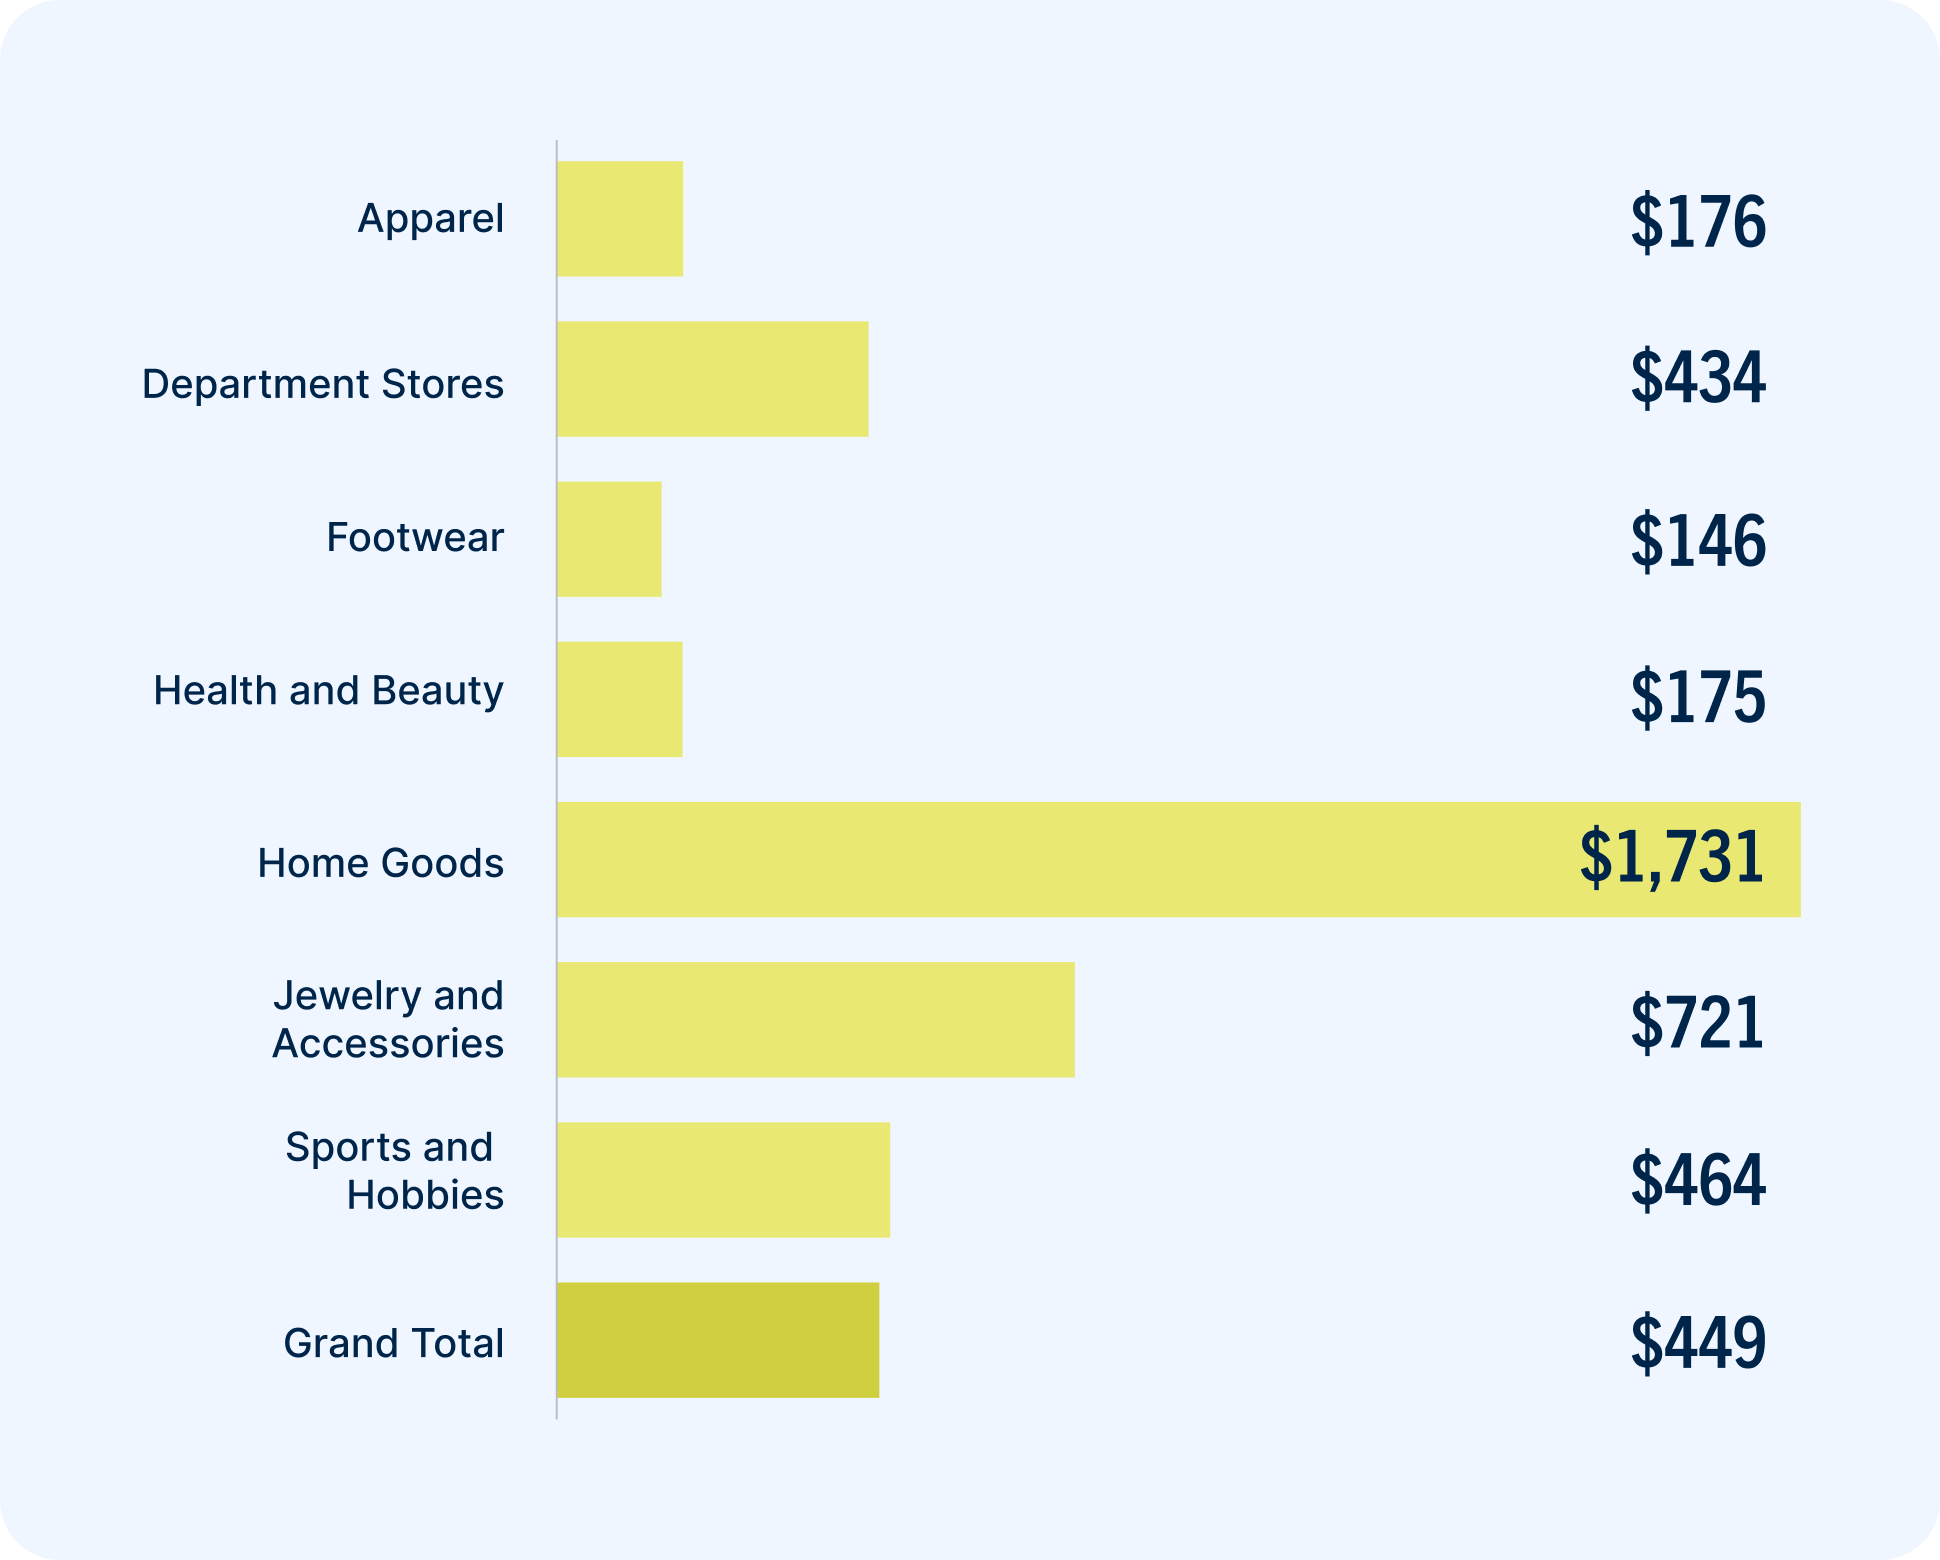
Sales per buyer is calculated by a retailer’s total sales divided by its total buyers. Here, these figures represent how much revenue the average customer yields during their first year.
Sales per buyer are marginally higher than average order value because with the exception of health and beauty, every vertical’s average purchase frequency fell between one and two purchases per year. This benchmark shows why purchase frequency is so linked to customer retention. In the next section, you’ll see the staggering difference between how much new and active buyers order — and spend.
Turning browsers into buyers: Conversion rates for site campaigns
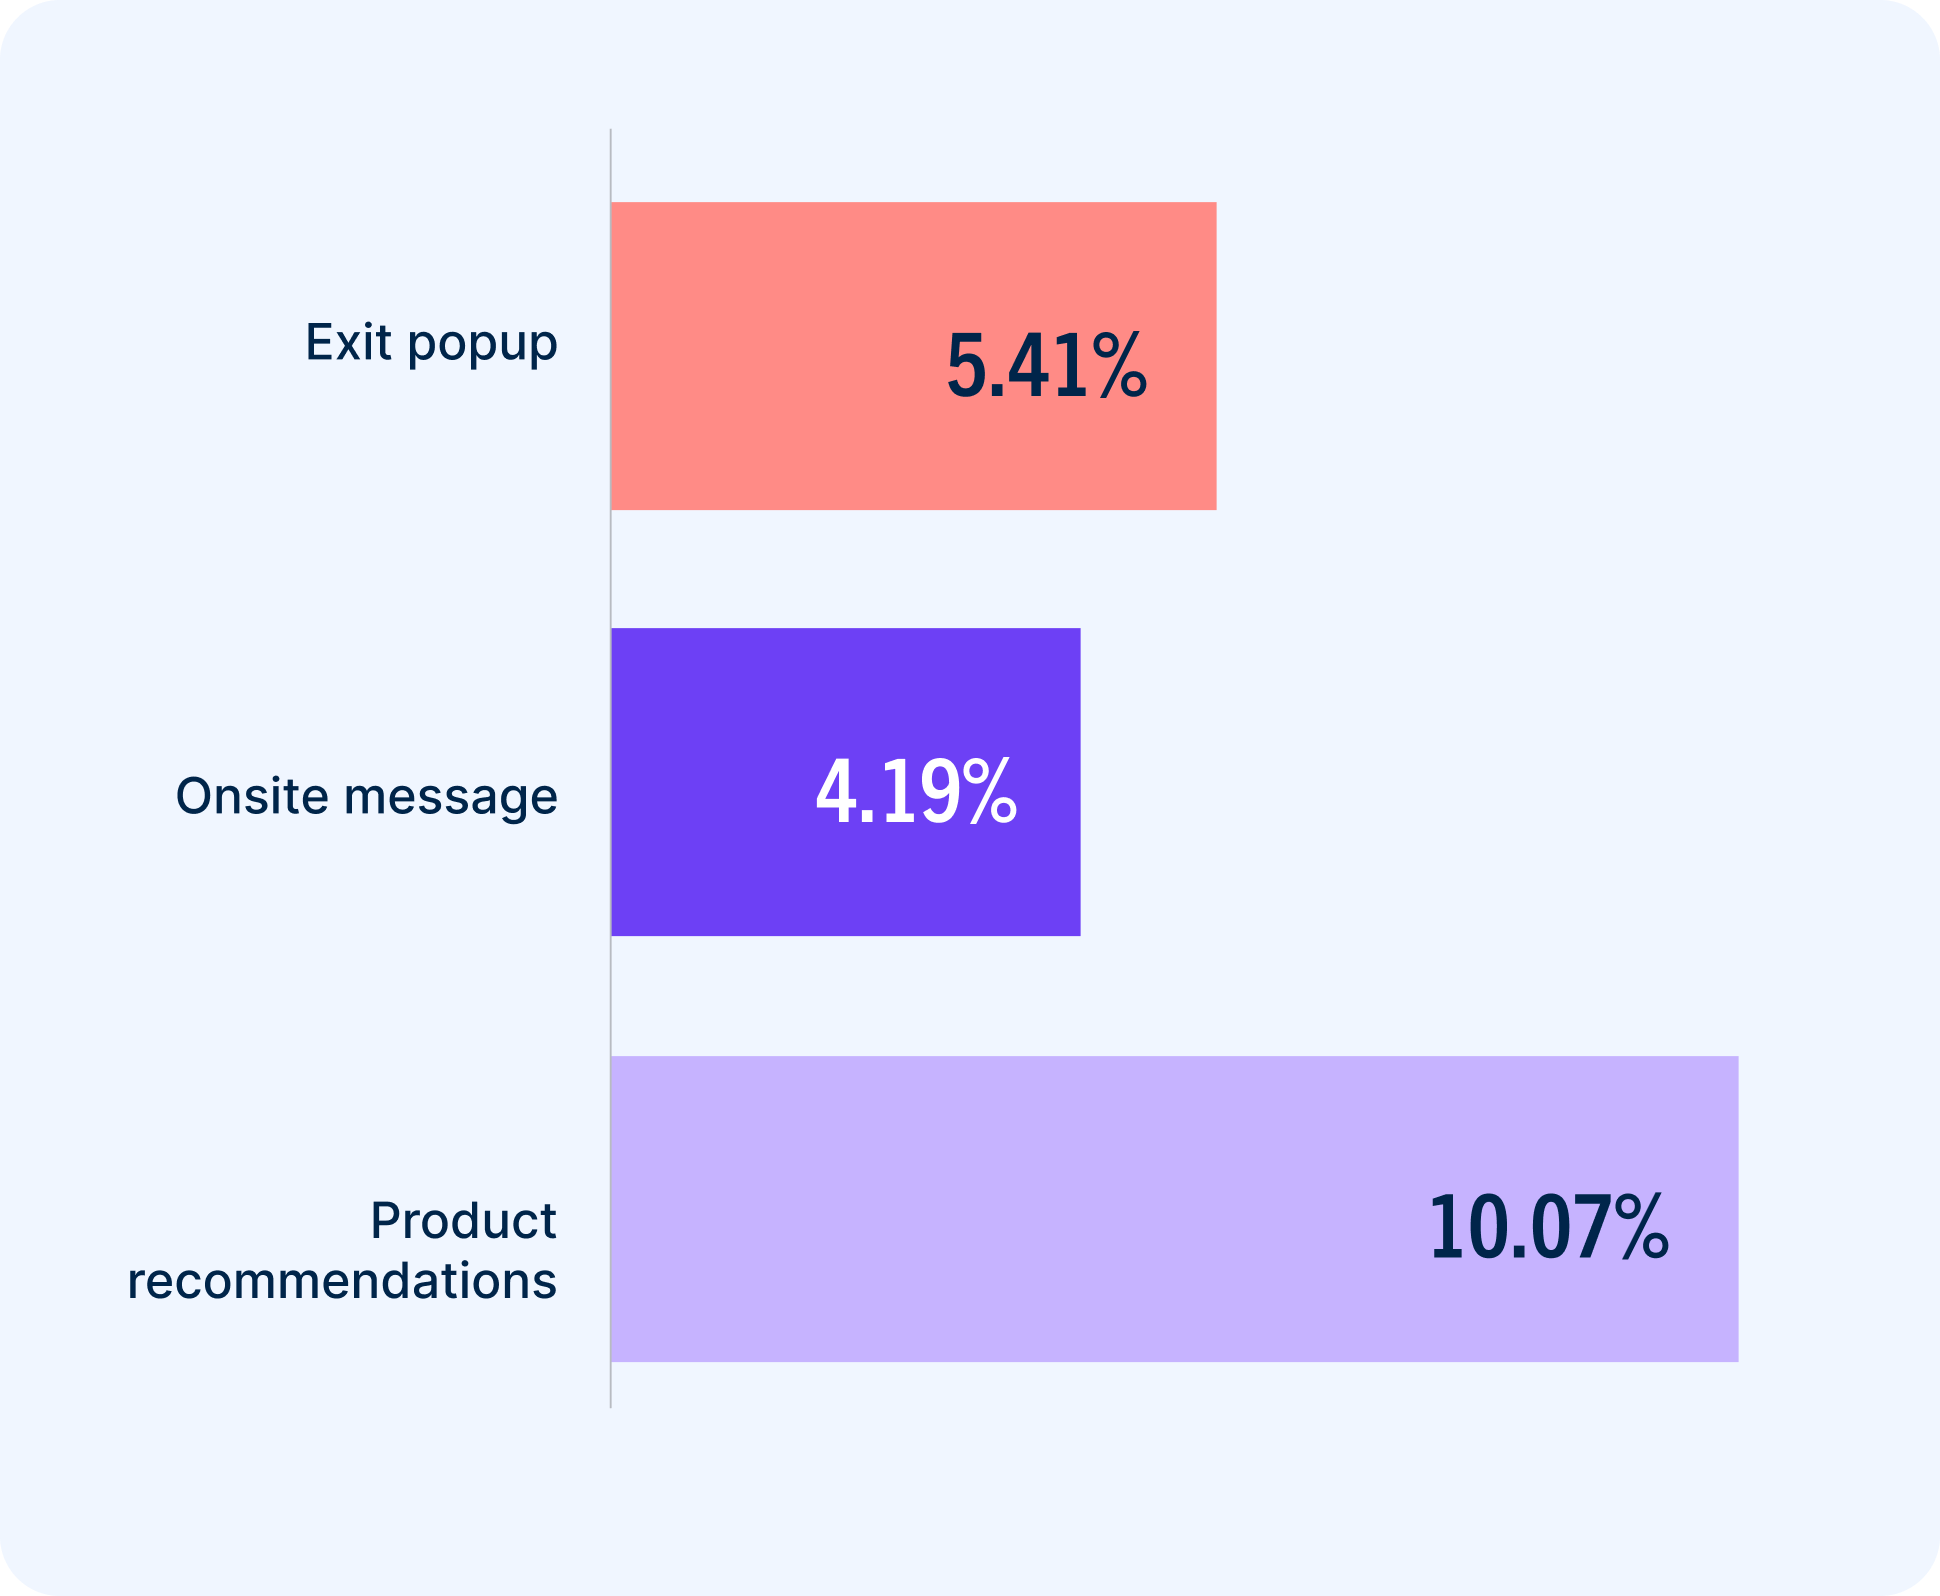
Shoppers often visit a retailer’s website unsure what exactly they’re looking for. Product recommendations help curate the catalog and account for up to 31% of ecommerce revenue. Our benchmarks back that up. Product recommendations drove far more conversions than exit popups or onsite messages, which are defined as site campaigns with offers or informational content.
However, product recommendations didn’t convert in a vacuum. The most performant product recommendations relied on shopping signals. Carted products and cocarts — which recommend products based on other customers who have added similar items to their carts — drove far more conversions than best sellers or similar products.
From sends to sales: Conversion rates for first purchase email campaigns
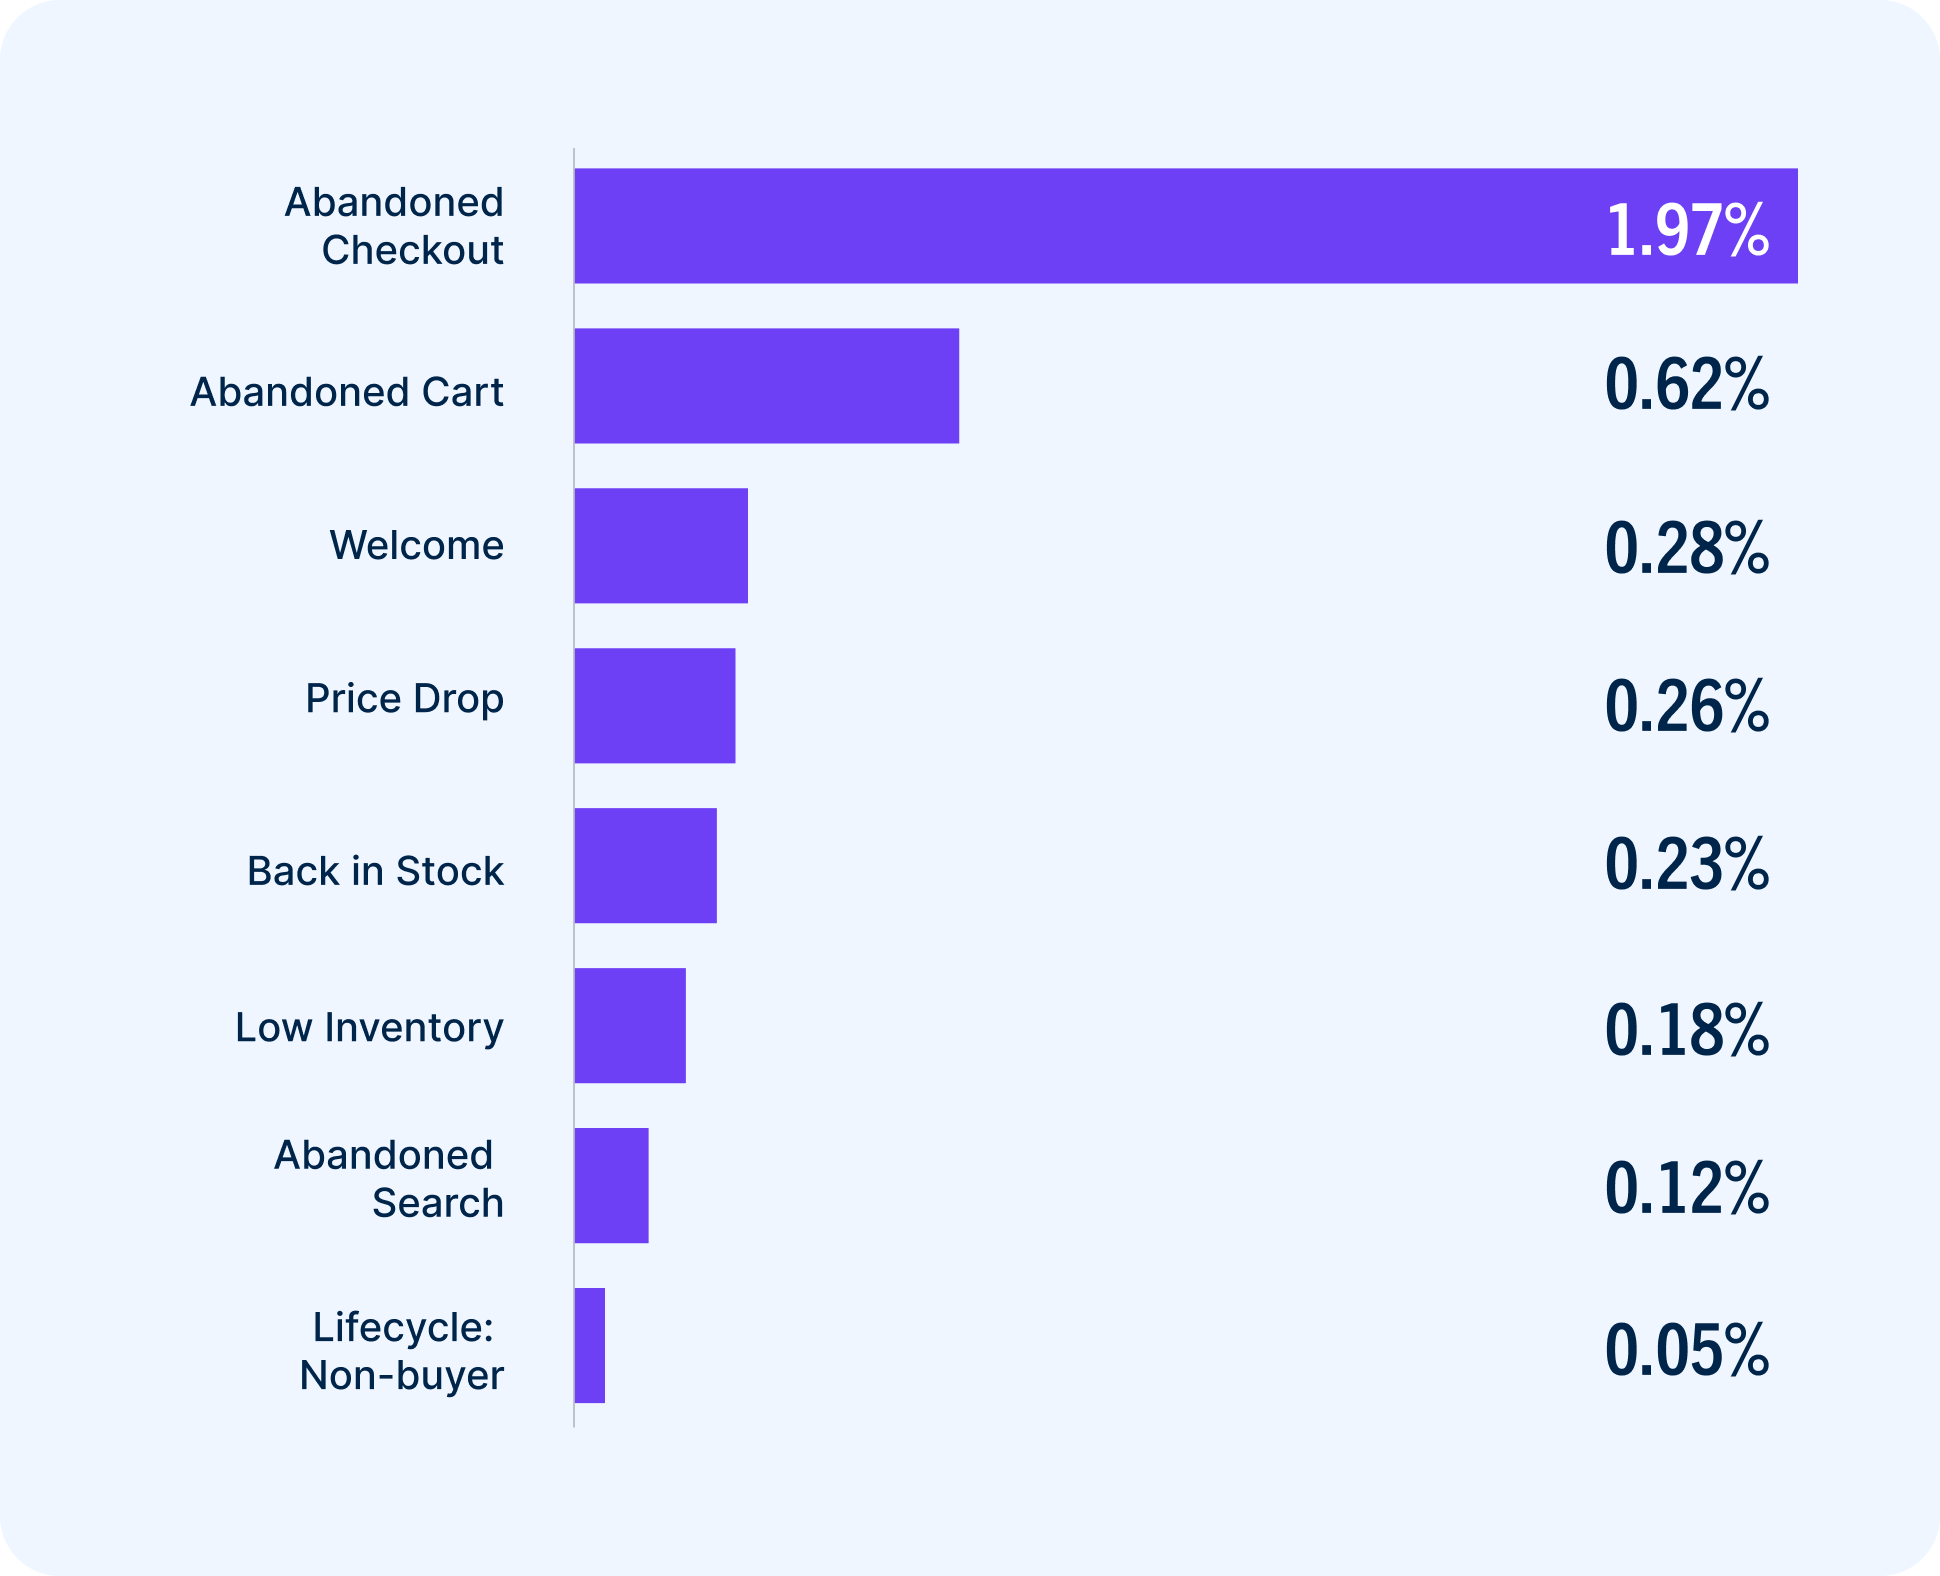
When it comes to email campaigns, personalization and purchase intent are the winning combination. Abandoned cart campaigns are widely regarded as a top trigger. Higher in the funnel, abandoned checkout campaigns drove 218% more conversions.
When someone signs up for a retailer’s email list, they’re sending a clear signal: “I want to hear from you.” Welcome emails allow retailers to capitalize on that, so it’s no surprise they rounded out the top three.

Retention: From first-time buyer to active buyer
The first purchase is a trial run. It could kick off a long relationship with your brand, or it can be the beginning and the end. Unfortunately, Bluecore research shows that nearly three-quarters of a retailer’s customers are one-and-one.
However, our research also shows that when someone becomes a repeat customer, you have a much better chance of retaining them. Once someone buys twice, the likelihood they buy a third time goes up by 95%.
Repeat customers are the lifeblood of retail. They have the biggest impact on a brand’s profit, which makes retention the most important stage of the customer lifecycle. Repeat customers also have more browsing and buying history than new ones, which gives you a lot more to work with as you personalize their experiences.
Buyer type breakdown: Percentage of retailers’ customer files by buyer type

Within a brand’s customer file, there are three types of buyers:
- New buyers, who made their first purchase this calendar year
- Active buyers, who have made a purchase — but not their first one — in the prior year
- Inactive buyers, who have made a purchase, but not in the past 13-24 months
The retention stage is all about turning those new buyers into active ones, represented by the coral bar in the middle. It’s worth noting that the verticals with the highest proportion of active buyers are also those with the highest identification rates.
Because their one-stop-shop nature lends itself to repeat purchases, department stores have particularly strong active customer bases. Apparel retailers weren’t too far behind, with large product catalogs and many opportunities for complementary purchases and cross-selling.
Jewelry and accessories, and home goods purchases are likely to be bigger and less frequent. These verticals have the most new and inactive buyers, respectively, which demonstrates how crucial it is to build loyalty.
Retention rate: The percentage of retailers’ prior-year purchasers who continue to buy
Think of retained customers as your most loyal active buyers. While the two benchmarks are similar, there is one major difference: Health and beauty retailers dominated this category.
The health and beauty vertical deals in consumables that will need to be replenished. More importantly, health and beauty products are inherently personalized, designed for people’s unique coloring and skin types. Because there are so many different types of products, these retailers also have many opportunities to turn their loyalists into cross-category customers.
Driving repeat purchases: Conversion rates for growth email campaigns
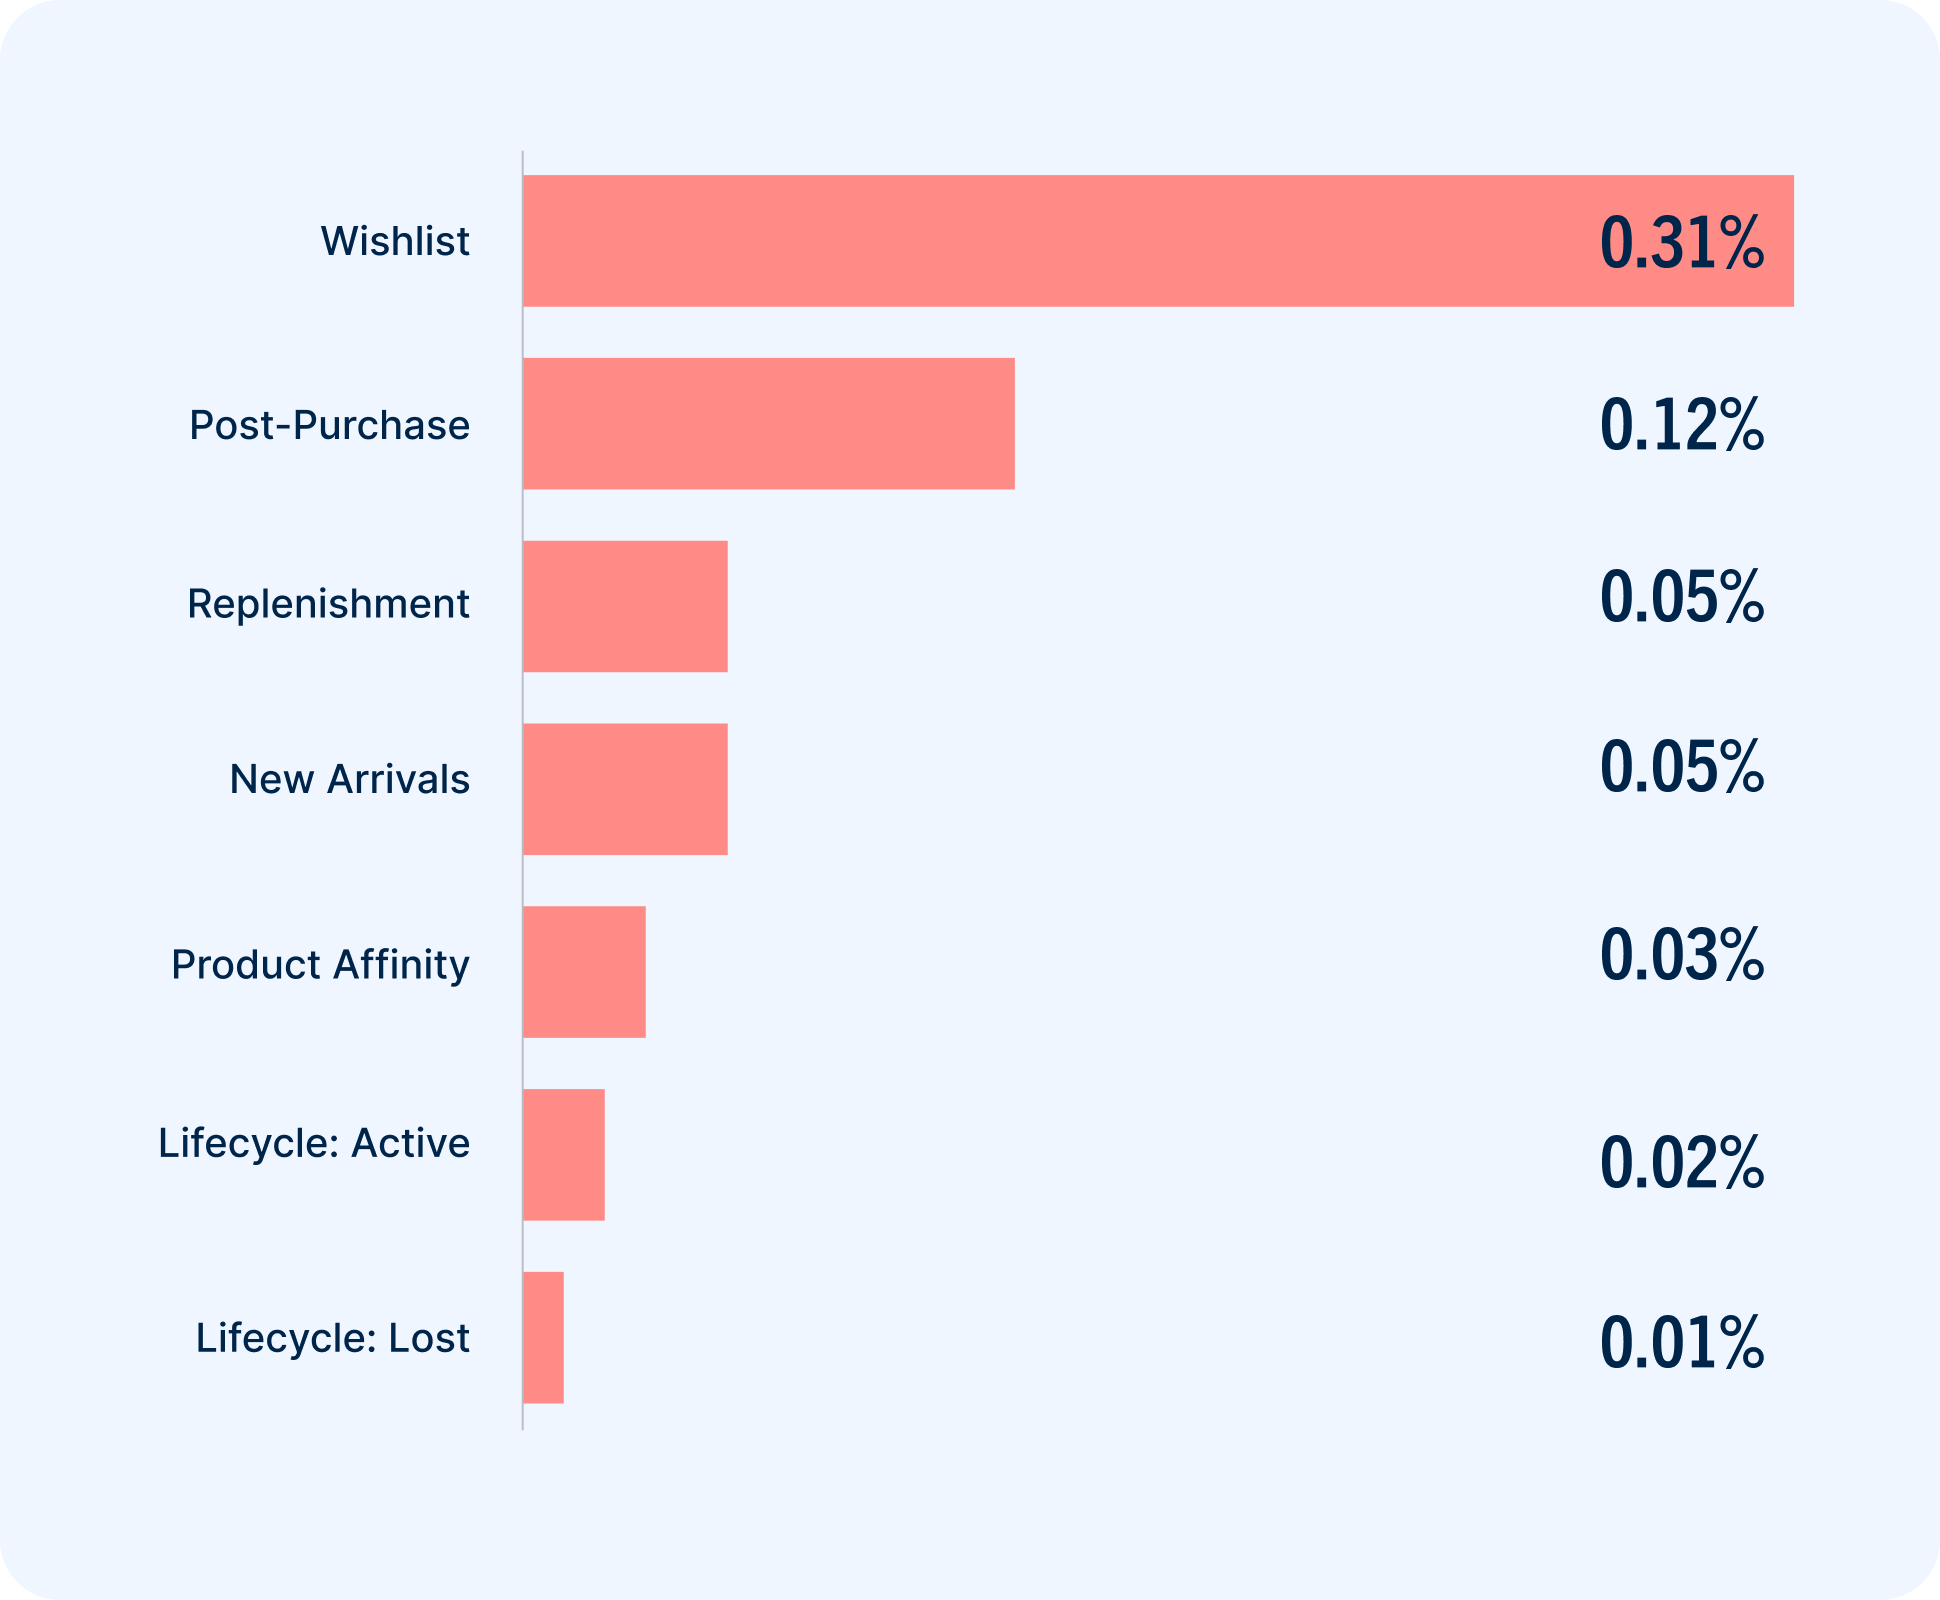
These conversion rates are lower than those in the previous section. That’s normal. The email campaigns benchmarked here are specifically built for repeat purchases, which are more of an uphill battle for retailers.
Still, the trends align. Adding an item to a wishlist shows strong purchase intent. It’s no surprise that wishlist emails drove the most conversions in this category.
Coming in at a distant second, post-purchase emails represent the biggest whitespace for retailers. Very few brands actually send them, despite 40% of consumers saying post-purchase is the most memorable part of the overall brand experience.
Customer survivorship: The percentage of new buyers that retailers retain for three years
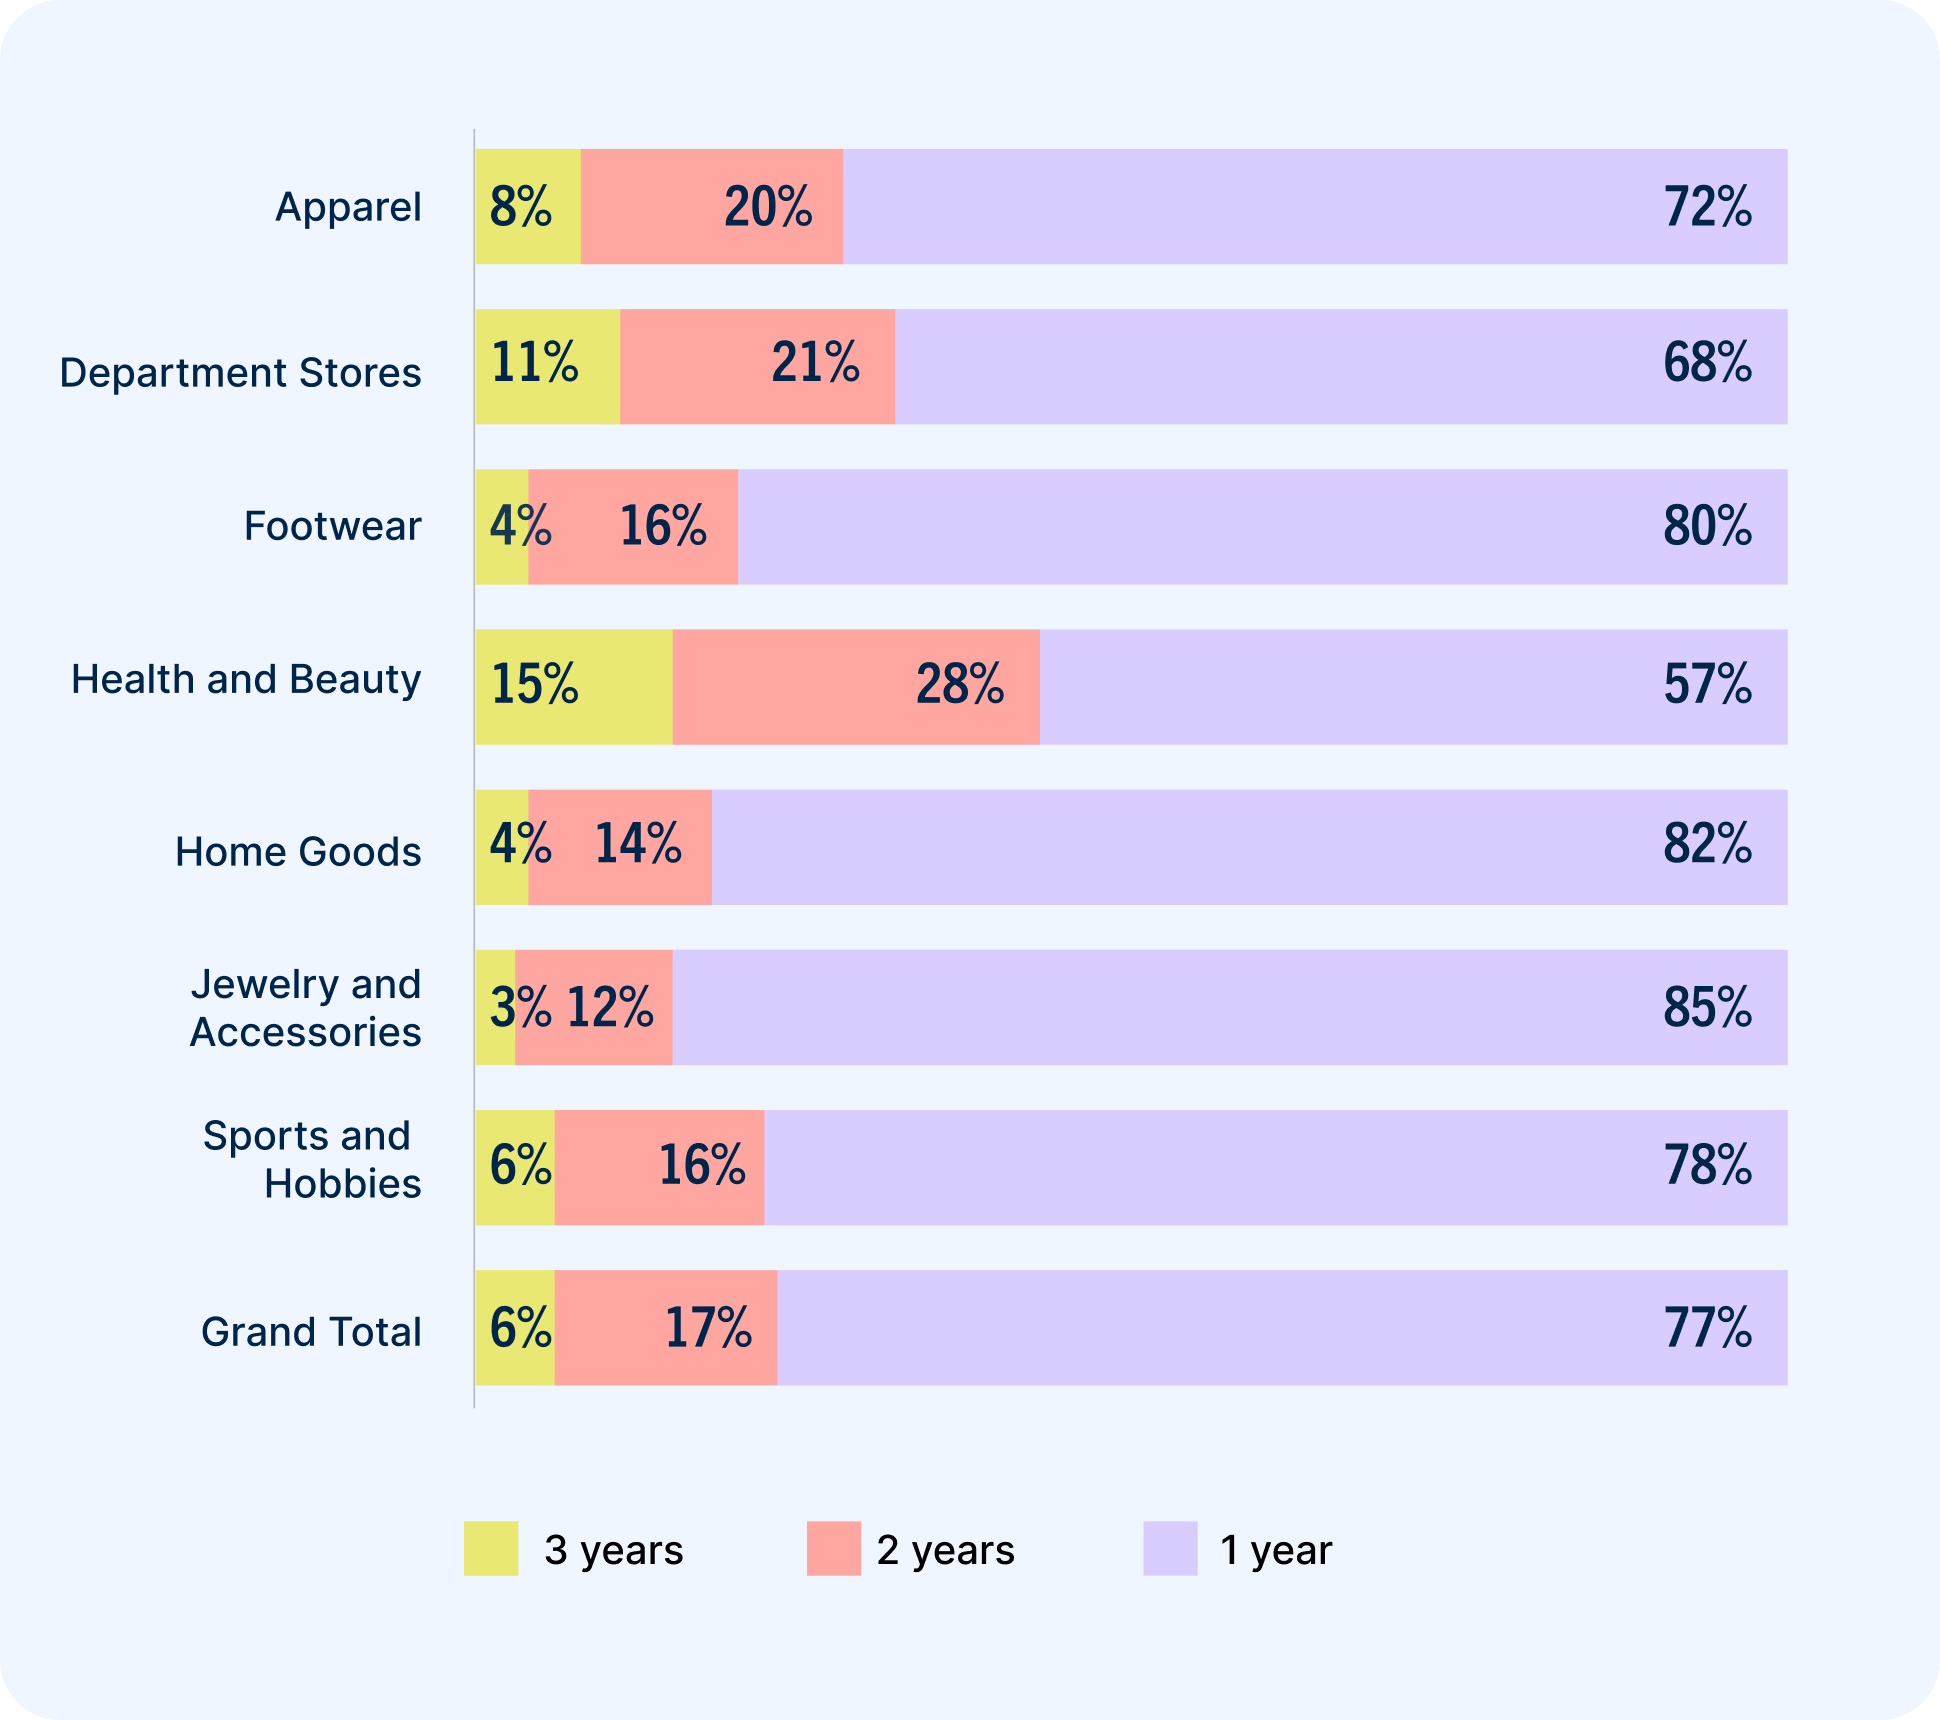
Survivorship is the percentage of new customers in a year that retailers retain for the following two years. This benchmark is different from the retention rate benchmark above, though the same verticals lead and lag in both categories. In a world where many retailers are forced to look short-term, survivorship is a strong signal of long-term profitability.
To create the most accurate comparisons, we use the number 100 as a proxy. That means the average retailer started with 100 new buyers. Three years later, just six of them — represented by the yellow bar — are still buying. That makes survivorship 6%. Across verticals, that percentage is fairly small and emphasizes just how crucial it is to nurture repeat buyers.
Purchase frequency growth: The percentage increase in orders per buyer from new to active buyers
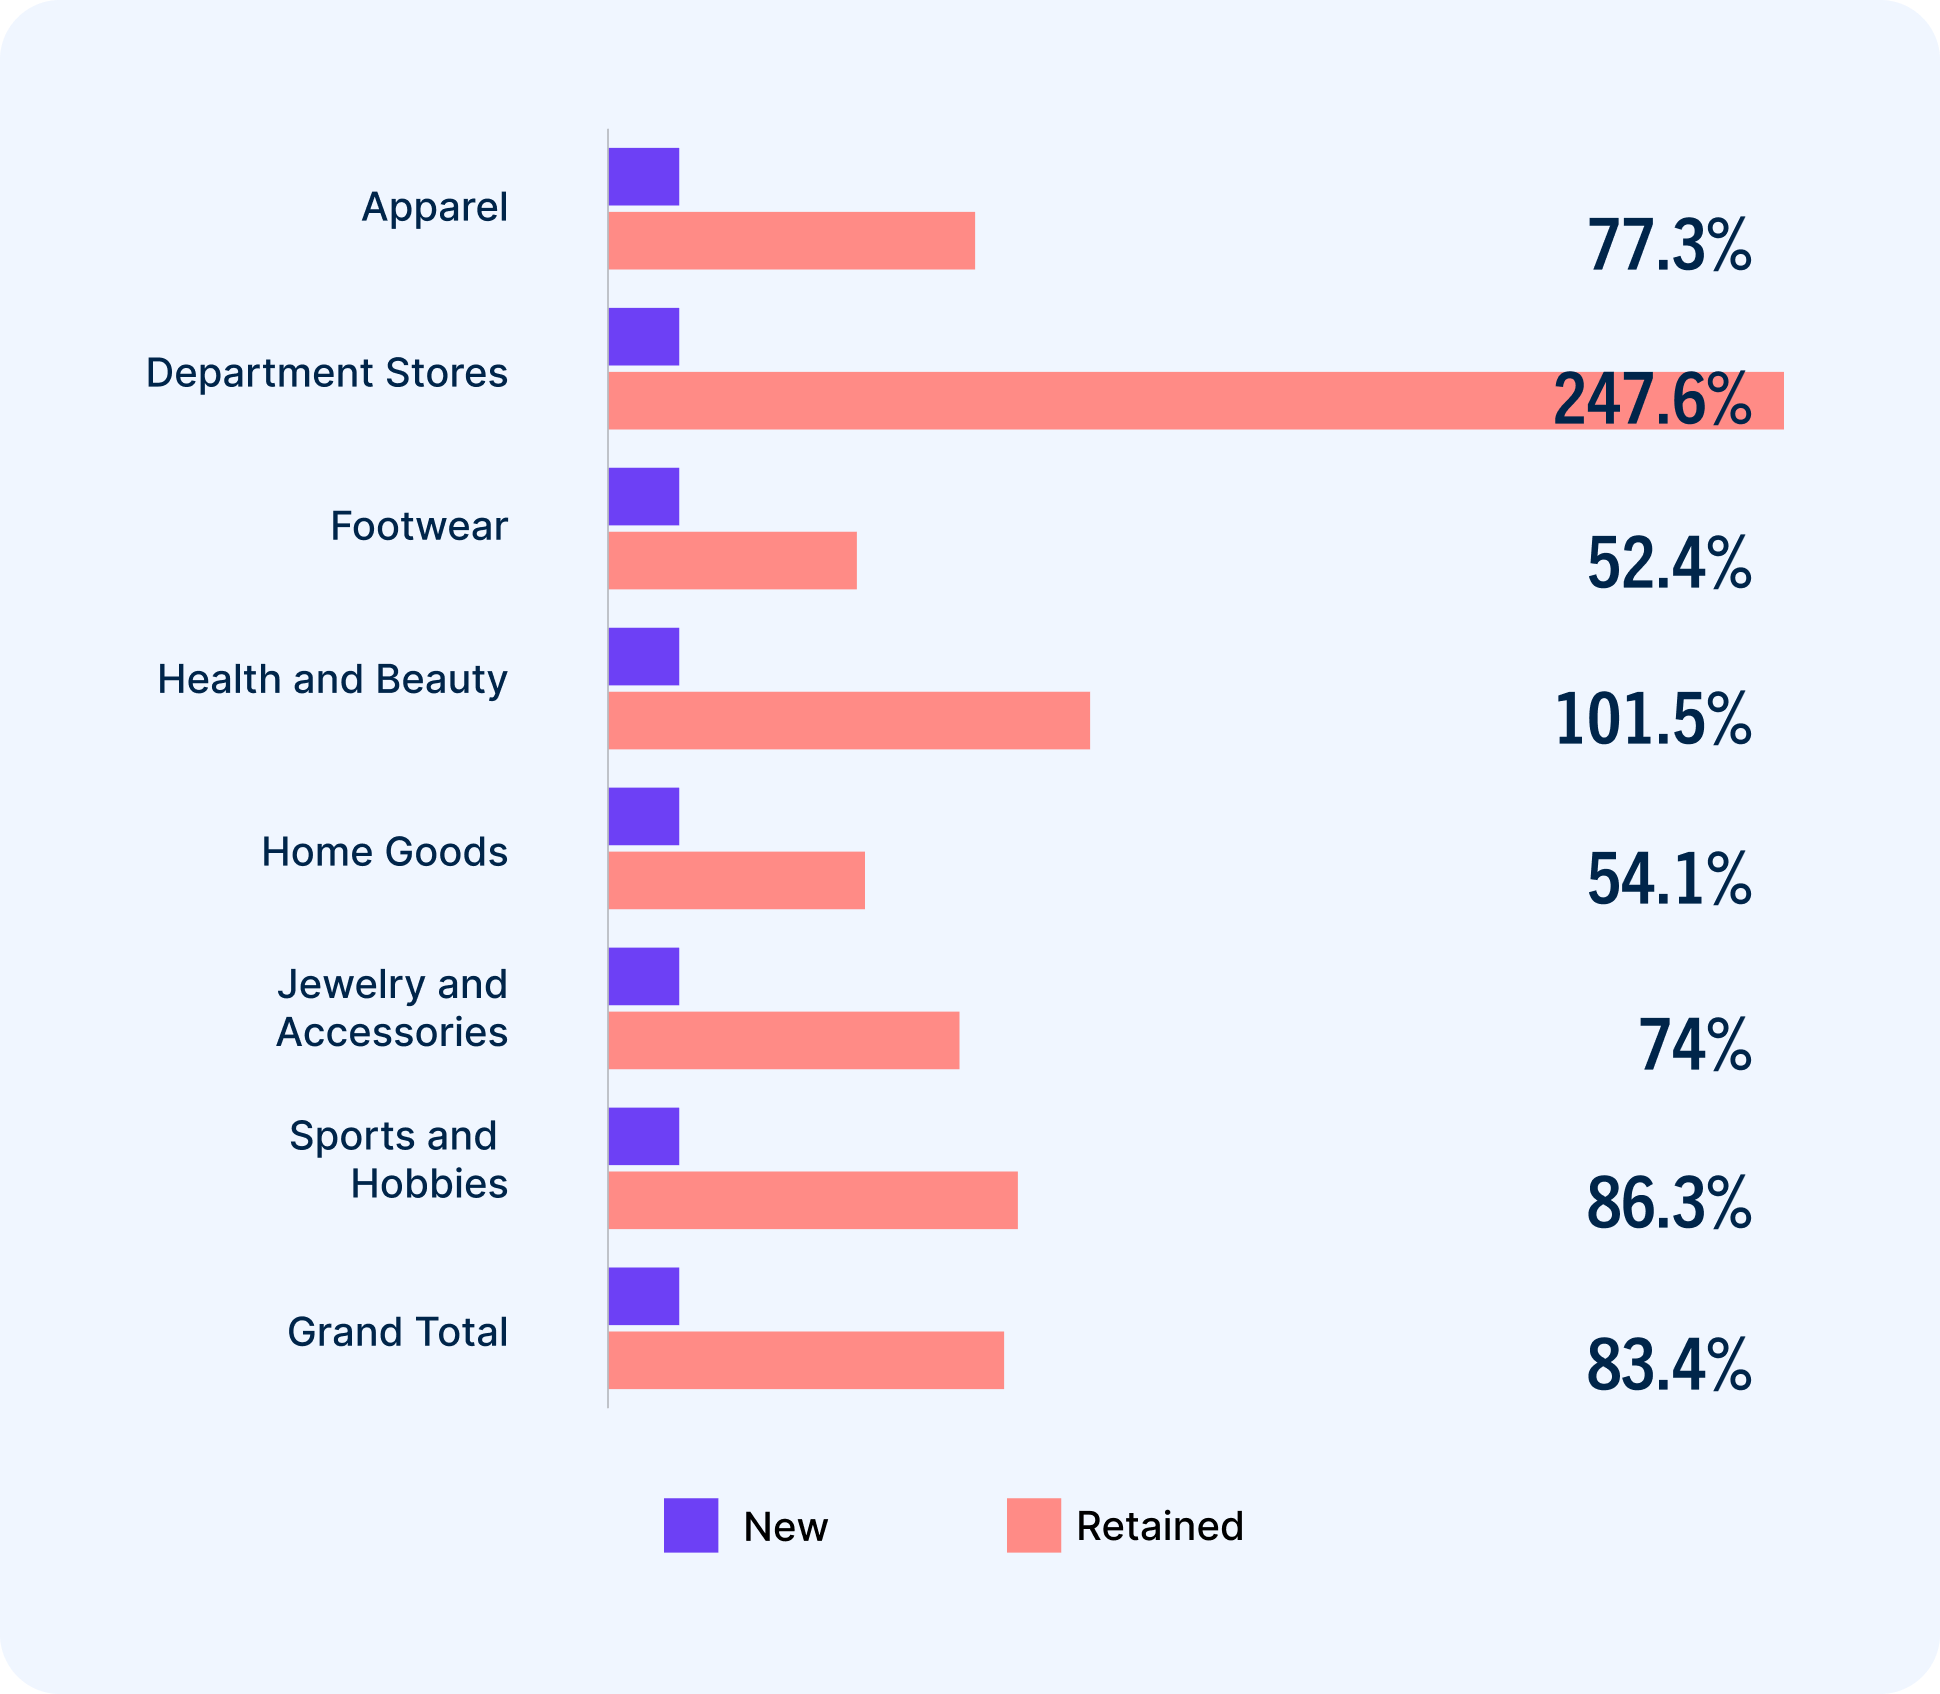
Revenue growth: The percentage increase in sales per buyer from new to active buyers

The percentages mark the difference in purchase frequency and sales per buyer between new and retained customers. More than any other, these benchmarks show the power of strong customer retention. Repeat buyers order — and spend — significantly far more than new customers across every vertical.
In 2023, active buyers placed 57.6% more orders and spent 69.2% more money than new buyers. Over 2024, these benchmarks have increased significantly across every vertical. Home goods retailers saw the smallest revenue growth percentage, though it’s still a 310% year-over-year increase.
The jewelry and accessories vertical shines a spotlight on just how much repeat customers drive profitability. These brands had the most new buyers by far, but the ones they retained spent 92.8% more.

Reactivation: From inactive to reactivated buyer
Loyalty is a marathon, not a sprint.
Engagement is a continuous process because customers often lapse and become inactive. While lapsed buyers are often overlooked, they’re a hidden gem in every retailer’s customer file. Reactivated customers drive more revenue than new ones and because they’re already familiar with your brand, reactivation is far more cost-effective than acquisition.
That they’re already familiar with your brand is good news. Because you already know them, you have a strong pool of signals — not to mention purchase history — to work with in order to welcome them back into the fold.
Reactivation rate: The percentage of lapsed customers retailers were able to reactivate
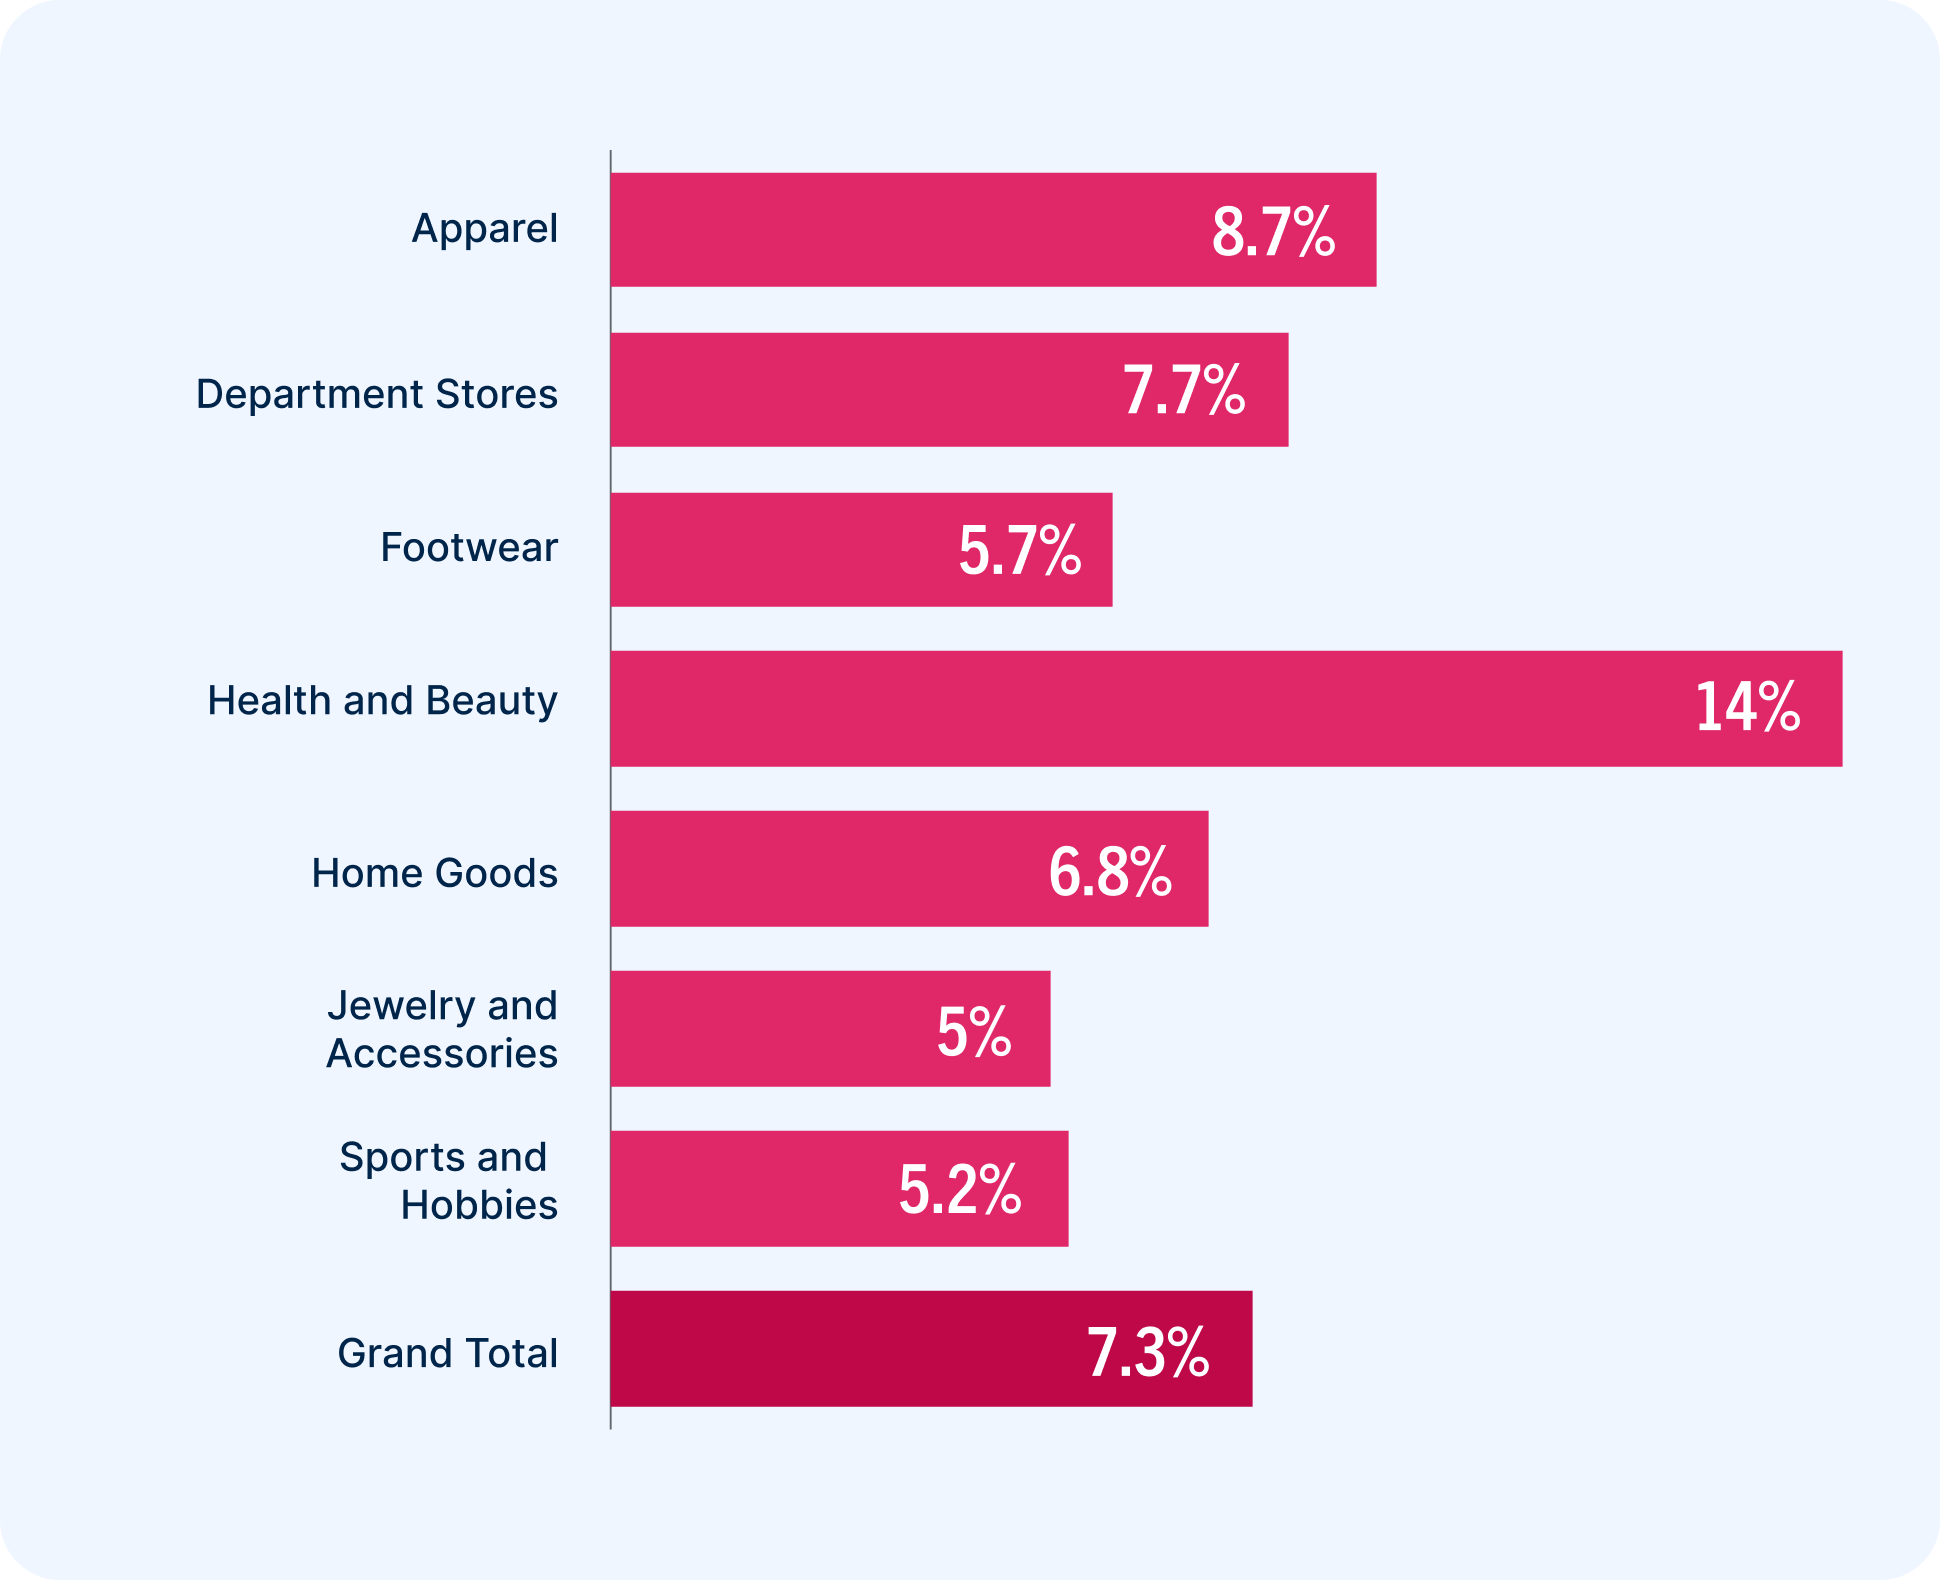
Reactivation rate refers to the percentage of lapsed buyers who were reactivated this year. This is a major opportunity across every vertical, one that retailers seem to recognize. Overall, reactivation rates increased by 10.6% from 2023 to 2024.
With the exception of sports and hobbies, every vertical saw year-over-year growth in reactivation rates, with health and beauty leading the pack.
Purchase frequency growth: The percentage increase in orders per buyer from new to reactivated buyers
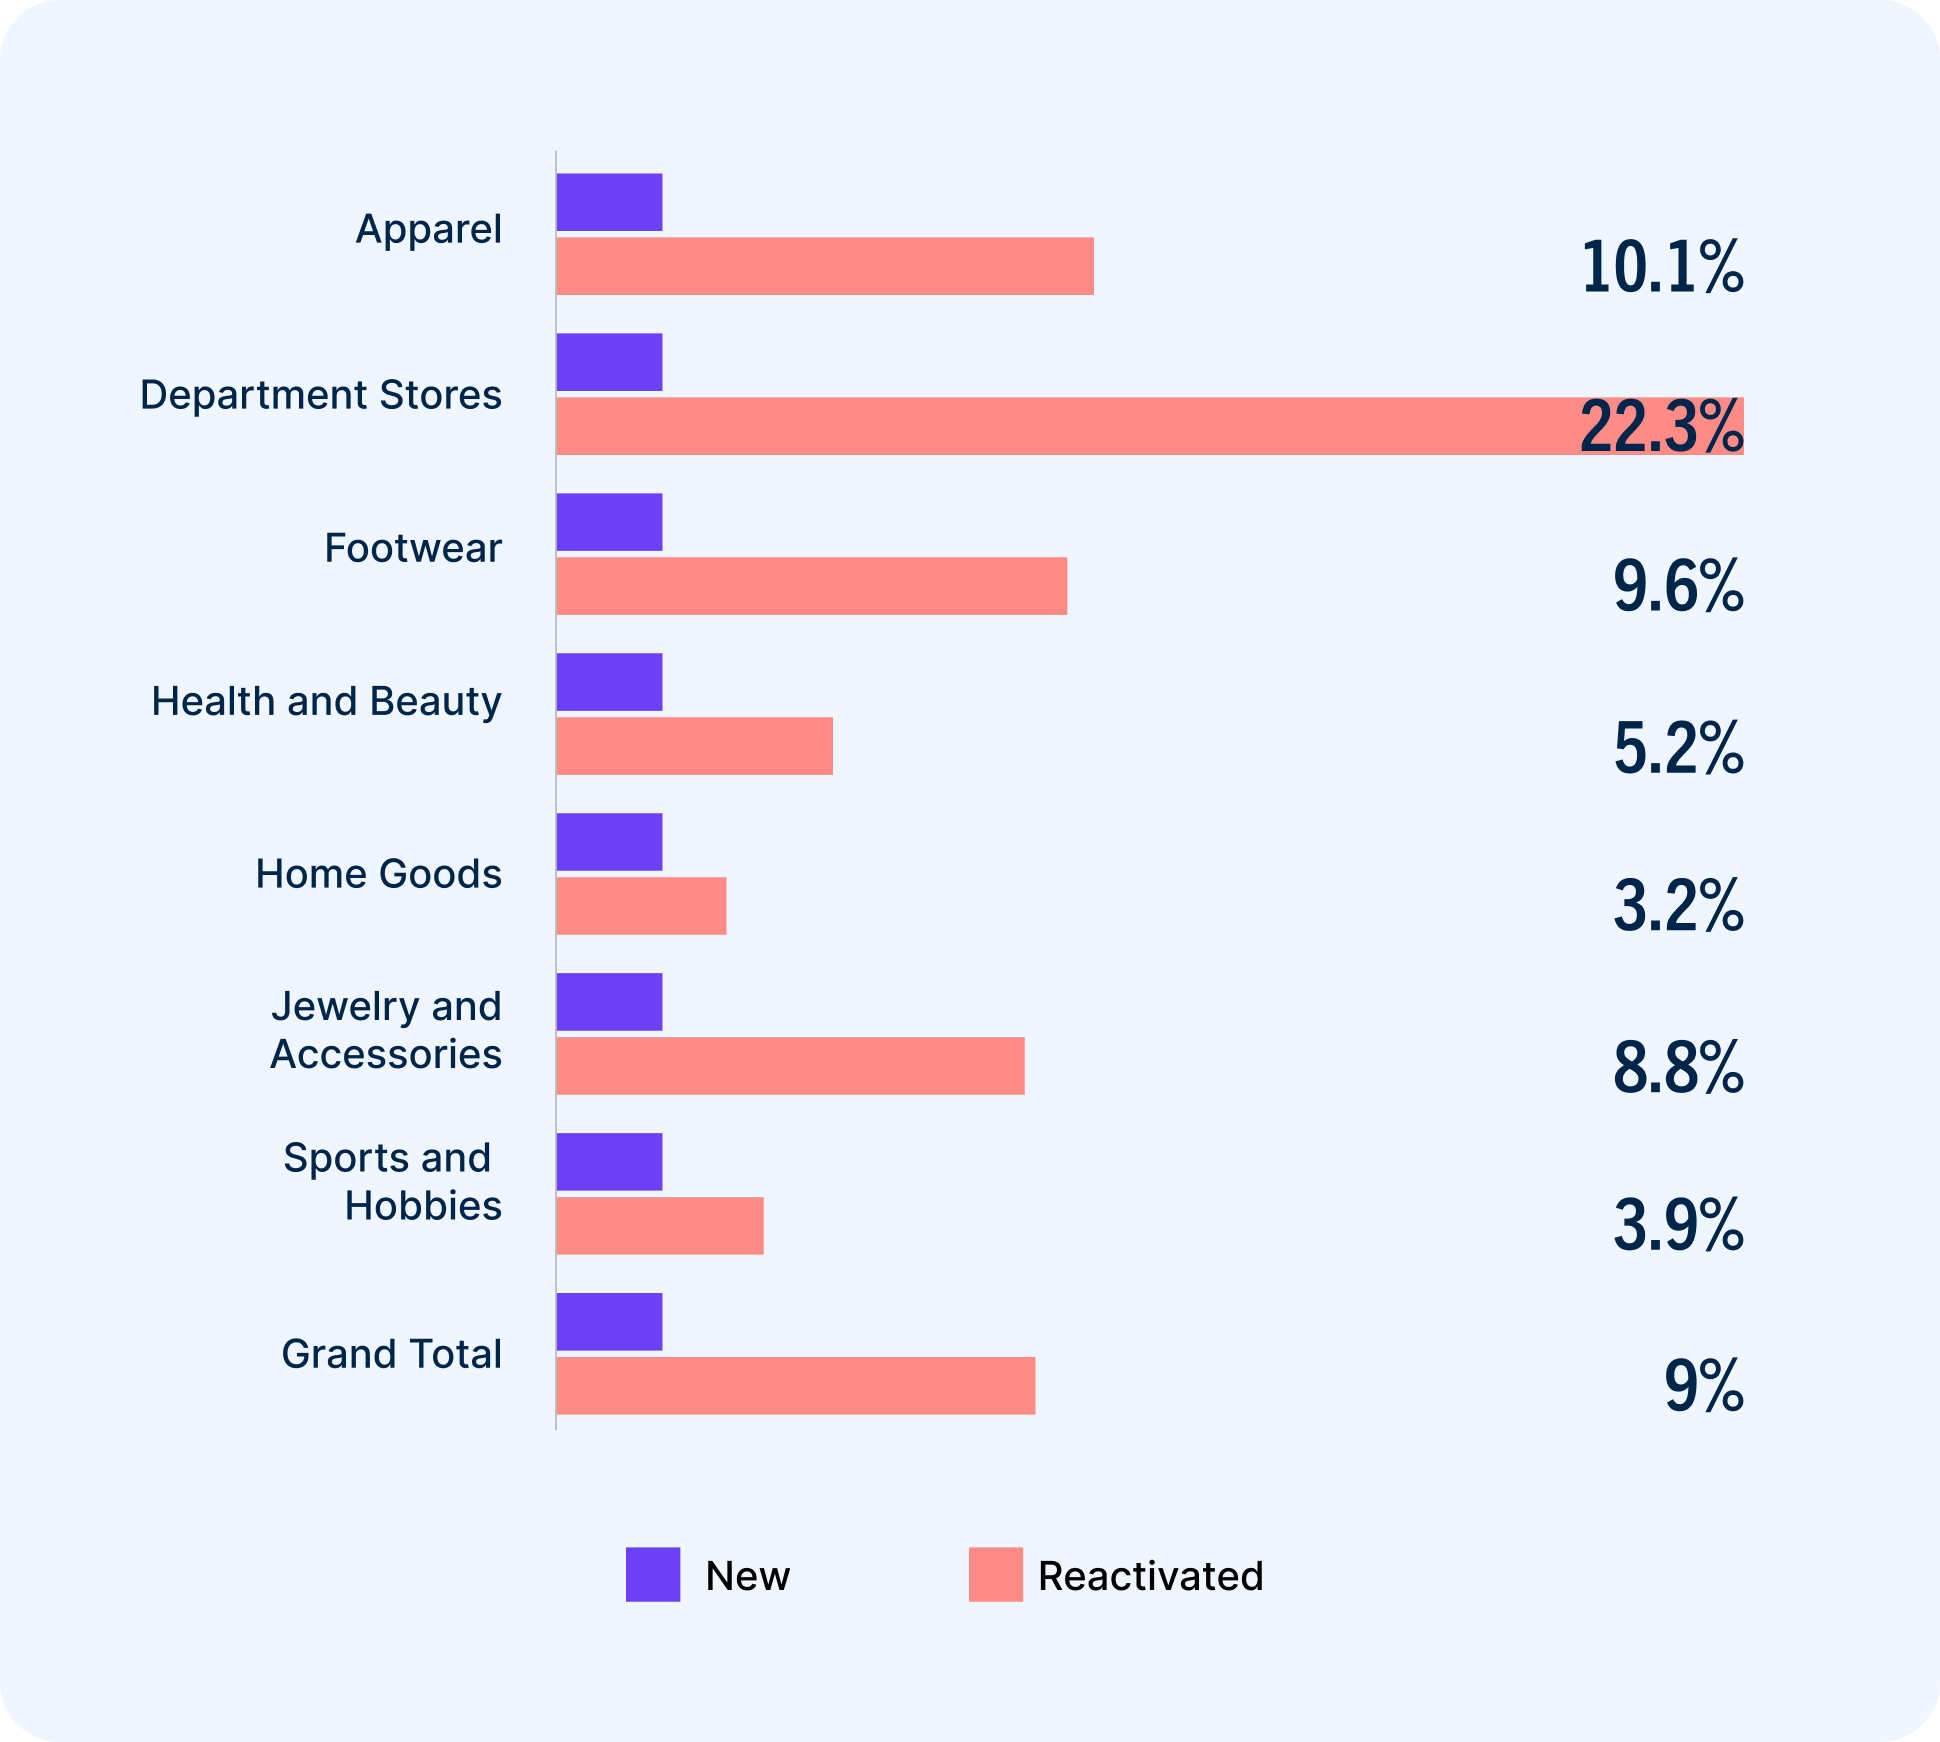
Revenue growth: The percentage increase in sales per buyer from new to reactivated buyers
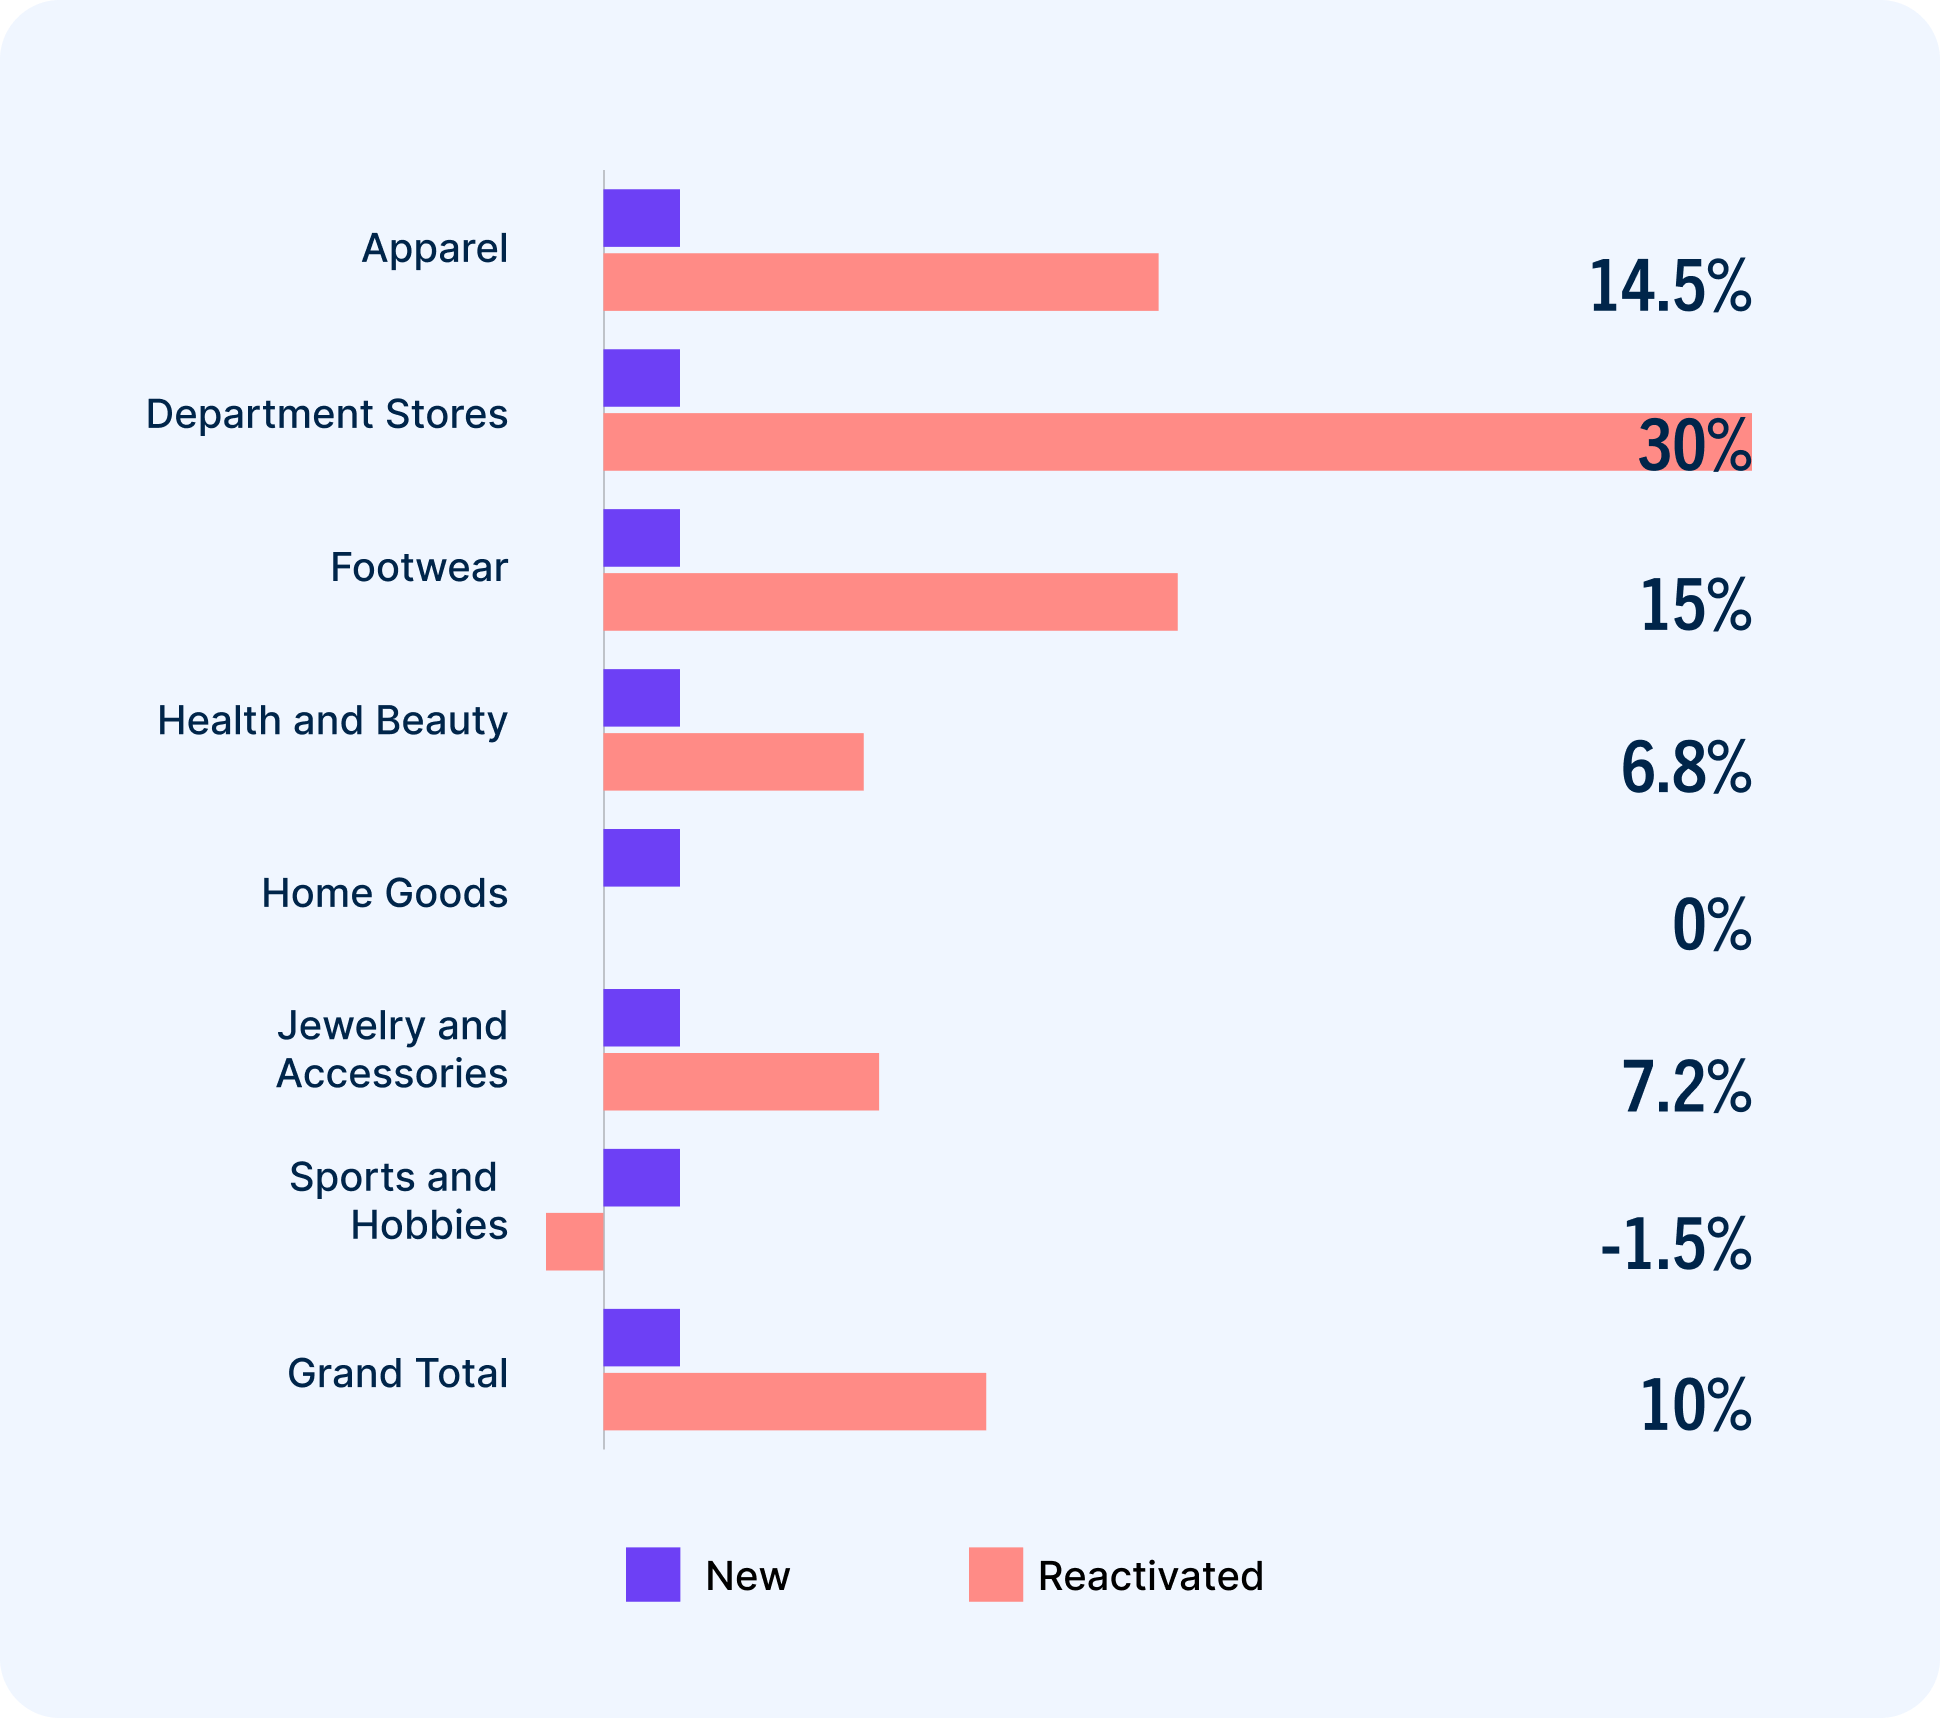
Across every vertical, reactivated buyers order more than new ones. With one small exception, they spend more, too. Health and beauty retailers re-engaged the most lapsed buyers by far. However, notice the superior purchase frequency and revenue growth from other verticals.
These two charts illustrate what retailers — particularly those in the jewelry and accessories, and footwear verticals, both of which had below average reactivation rates — are missing out on by not prioritizing their lapsed buyers. The takeaway: Reactivated buyers are worth their weight in gold.

Assess your customer movement
Our Customer Movement Assessment helps retailers aim their investments and strategies at the highest-priority growth opportunities within their customer base. Conducting an in-depth analysis of your customer file across active, inactive, new buyer cohorts, our retail strategy team makes surgical recommendations for capitalizing on incremental growth opportunities.
In addition to the analysis, you’ll receive peer benchmarking for purchase frequency, survivorship, new buyer penetration, and AOV growth, prescriptive campaign recommendations, and a full strategy blueprint for how Bluecore can help you achieve your highest growth priorities.
Request your own assessment and join the customer movement.
Get started